
Page 121 - The role of advanced echocardiography in patients with ischemic heart disease - Rachid Abou
P. 121
6
115
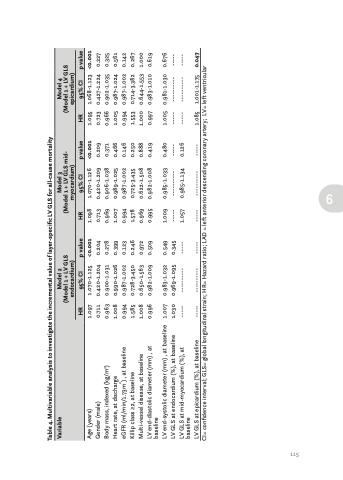
Table 4. Multivariable analysis to investigate the incremental value of layer-specific LV GLS for all-cause mortality
Variable
Model 2 (Model 1 + LV GLS endocardium)
Model 3 (Model 1 + LV GLS mid- myocardium)
Model 4 (Model 1 + LV GLS epicardium)
Age (years)
1.097 0.711 0.963 1.008 0.994 1.585 1.008 0.996
1.070-1.125 0.420-1.204 0.900-1.031 0.990-1.026 0.987-1.002 0.728-3.450 0.650-1.563 0.982-1.009
1.098 0.713 0.969 1.007 0.994 1.578 0.969 0.995
1.070-1.126 0.420-1.209 0.906-1.038 0.989-1.025 0.987-1.002 0.725-3.435 0.622-1.508 0.982-1.008
1.068-1.123 0.427-1.224 0.902-1.035 0.987-1.024 0.987-1.002 0.714-3.382 0.644-1.553 0.983-1.010
Gender (male)
0.209 0.371 0.466 0.146 0.250 0.888 0.419
0.723 0.966 1.005 0.994 1.553 1.000 0.997
Body mass, indexed (kg/m2)
Heart rate, at discharge
eGFR (ml/min/1.73m2) , at baseline
Killip class ≥2, at baseline
Multi-vessel disease, at baseline
LV end-diastolic diameter (mm) , at baseline
LV end-systolic diameter (mm) , at baseline LV GLS at endocardium (%), at baseline
1.007 1.030 -----
0.983-1.032 0.969-1.095 ----------
0.549 0.345 -----
1.009 ----- 1.057
0.985-1.033 ---------- 0.985-1.134
0.480 ----- 0.126
1.005 ----- -----
0.981-1.030 ---------- ----------
0.676 ----- -----
LV GLS at mid-myocardium (%), at baseline
HR
95% CI
HR
p value <0.001 0.204 0.278 0.399 0.123 0.246 0.972 0.509
HR
95% CI
p value
<0.001 1.095
95% CI
p value <0.001 0.227 0.325 0.561 0.142 0.267 1.000 0.619
-----
CI= confidence interval; GLS= global longitudinal strain; HR= Hazard ratio; LAD = left anterior descending coronary artery; LV= left ventricular
LV GLS at epicardium (%), at baseline
-----
----------
-----
-----
----------
1.085
1.001-1.175
0.047
