
Page 140 - Assessing right ventricular function and the pulmonary circulation in pulmonary hypertension Onno Anthonius Spruijt
P. 140
Pa entA Pa entB
8
AC
0.20 r2=0.38 (p=0.111) 0.15
0.10
0.05
0.00
0.20 0.15 0.10 0.05 0.00
0.20 0.15 0.10 0.05 0.00
0
r2=0.042 (p=0.625)
500 1000 1500 PVRI
r2=0.65 (p=0.015)
020406080100 mPAP (mmHg)
B
(n=6) (n=8)
0.20 r2=0.51 (p=0.048) 0.15
0.10 0.05 0.00
0.20 0.15 0.10 0.05 0.00
0 50 100 150 RVEDVI (ml/m2)
0 50 100 150 RVESVI (ml/m2)
r2=0.54 (p=0.037)
20
RVEF (%)
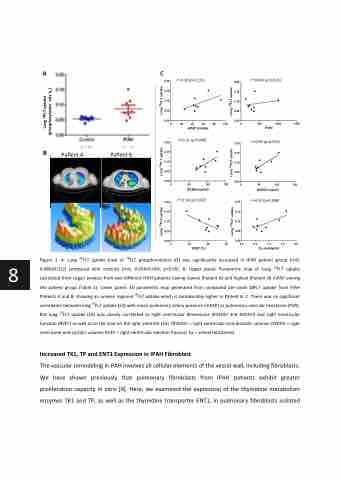
Figure 1. A. Lung 18FLT uptake (rate of 18FLT phosphorylation k3) was significantly increased in IPAH patient group (n=8, 0.086±0.012) compared with controls (n=6, 0.054±0.004; p<0.05). B. Upper panel: Parametric map of Lung 18FLT uptake calculated from Logan analysis from two different IPAH patients having lowest (Patient A) and highest (Patient B) mPAP among the patient group (Table 1). Lower panel: 3D parametric map generated from computed per‐voxel 18FLT uptake from IPAH Patients A and B, showing an uneven regional 18FLT uptake which is considerably higher in Patient B. C. There was no significant correlation between lung 18FLT uptake (k3) with mean pulmonary artery pressure (mPAP) or pulmonary vascular resistance (PVR). But lung 18FLT uptake (k3) was closely correlated to right ventricular dimensions (RVEDVI and RVESVI) and right ventricular function (RVEF) as well as to the load on the right ventricle (Ea). (RVEDVI = right ventricular end‐diastolic volume; RVESVI = right ventricular end‐systolic volume; RVEF = right ventricular ejection fraction; Ea = arterial elastance).
Increased TK1, TP and ENT1 Expression in IPAH Fibroblast
The vascular remodeling in PAH involves all cellular elements of the vessel wall, including fibroblasts. We have shown previously that pulmonary fibroblasts from IPAH patients exhibit greater proliferation capacity in vitro [9]. Here, we examined the expression of the thymidine metabolism enzymes TK1 and TP, as well as the thymidine transporter ENT1, in pulmonary fibroblasts isolated
0.20 0.15 0.10 0.05
r2=0.50 (p=0.048)
0
40
60
0.00
0.0 0.5 1.0 1.5 2.0
Ea (mmHg/ml)
Lung 18FLT uptake Lung 18FLT uptake Lung 18FLT uptake
Lung 18FLT uptake Lung 18FLT uptake Lung 18FLT uptake
Lung 18FLT uptake (phosphoryla on rate k3)
