
Page 120 - DISINVESTMENT AND IMPLEMENTATION OF VISION SCREENING TESTS BASED ON THEIR EFFECTIVENESS
P. 120
CHAPTER 6
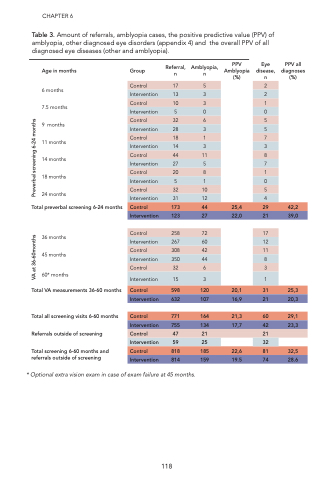
Table 3. Amount of referrals, amblyopia cases, the positive predictive value (PPV) of amblyopia, other diagnosed eye disorders (appendix 4) and the overall PPV of all diagnosed eye diseases (other and amblyopia).
Age in months
6 months
7.5 months
9 months
11 months
14 months
18 months
24 months
Total preverbal screening 6-24 months
36 months 45 months
60* months
Total VA measurements 36-60 months
Total all screening visits 6-60 months Referrals outside of screening
Total screening 6-60 months and referrals outside of screening
Referral, Group n
Amblyopia, n
PPV Eye Amblyopia disease, (%) n
PPV all diagnoses (%)
Control
Intervention
Control
Intervention
Control
Intervention
Control
Intervention
Control
Intervention
Control
Intervention
Control
Intervention
Control
Intervention
17
13
10
5
32
28
18
14
44
27
20
5
32
31
173
123
5
3
3
0
6
3
1
3
11
5
8
1
10
12
44
27
25,4
22,0
2
2
1
0
5
5
7
3
8
7
1
0
5
4
29
21
42,2
39,0
Control
Intervention
Control
Intervention
Control
Intervention
Control
Intervention
258
267
308
350
32
15
598
632
72
60
42
44
6
3
120
107
20,1
16,9
17
12
11
8
3
1
31
21
25,3
20,3
Control
Intervention
Control
771
755
47
164
134
21
21,3
17,7
60
42
21
29,1
23,3
Intervention
Control
Intervention
59
818
814
25
185
159
22,6
19.5
32
81
74
32,5
28.6
* Optional extra vision exam in case of exam failure at 45 months.
118
VA at 36-60months Preverbal screening 6-24 months
