
Page 118 - DISINVESTMENT AND IMPLEMENTATION OF VISION SCREENING TESTS BASED ON THEIR EFFECTIVENESS
P. 118
CHAPTER 6
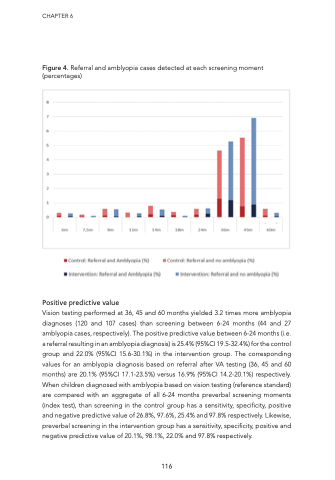
Figure 4. Referral and amblyopia cases detected at each screening moment (percentages)
Positive predictive value
Vision testing performed at 36, 45 and 60 months yielded 3.2 times more amblyopia diagnoses (120 and 107 cases) than screening between 6-24 months (44 and 27 amblyopia cases, respectively). The positive predictive value between 6-24 months (i.e. a referral resulting in an amblyopia diagnosis) is 25.4% (95%CI 19.5-32.4%) for the control group and 22.0% (95%CI 15.6-30.1%) in the intervention group. The corresponding values for an amblyopia diagnosis based on referral after VA testing (36, 45 and 60 months) are 20.1% (95%CI 17.1-23.5%) versus 16.9% (95%CI 14.2-20.1%) respectively. When children diagnosed with amblyopia based on vision testing (reference standard) are compared with an aggregate of all 6-24 months preverbal screening moments (index test), than screening in the control group has a sensitivity, specificity, positive and negative predictive value of 26.8%, 97.6%, 25.4% and 97.8% respectively. Likewise, preverbal screening in the intervention group has a sensitivity, specificity, positive and negative predictive value of 20.1%, 98.1%, 22.0% and 97.8% respectively.
116
