
Page 222 - Emotions through the eyes of our closest living relatives- Exploring attentional and behavioral mechanisms
P. 222
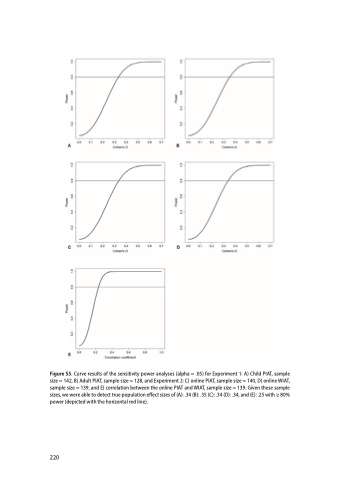
                                 Figure S5. Curve results of the sensitivity power analyses (alpha = .05) for Experiment 1: A) Child PIAT, sample size = 142, B) Adult PIAT, sample size = 128, and Experiment 2: C) online PIAT, sample size = 140, D) online WIAT, sample size = 139, and E) correlation between the online PIAT and WIAT, sample size = 139. Given these sample sizes, we were able to detect true population effect sizes of (A): .34 (B): .35 (C): .34 (D): .34, and (E): .25 with ≥ 80% power (depicted with the horizontal red line).
220
