
Page 40 - Go4it
P. 40
Chapter 3
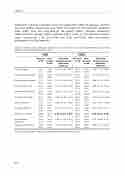
Adolescent reported problems were not significantly different between western and non-western adolescent (see Table 3) except for the Attention Problems scale (YSR). This was confirmed by the parent (CBCL). Western adolescent (YSR) and their parents (CBCL) reported higher levels on the attention problem scale, respectively 2.38 (p=0.026) and 3.26 (p=0.025) than non-western adolescents and their parents.
Table 3: Between group difference (western versus non-western) for the Youth Self-Report and Child Behaviour Checklist mean problem scores.
YSR
CBCL
Western Non- n=49 western
n=60
Adjusted between group difference (95% CI)
Western Non- n=49 western
n=60
Adjusted between group difference (95% CI)
Total Problems 54.6 53.2 1.57 (-1.79; 4.93)1 (7.7) (8.4)
60.4 58.9 (9.2) (9.0)
2.08 (-1.70; 5.86)
Internalizing Problems 54.7 54.4 (8.3) (8.2)
0.09 (-3.34; 3.52)
61.3 61.7 -0.40 (-4.81; 4.01) (10.7) (10.5)
Externalizing Problems 51.5 50.6 (8.1) (9.4)
1.74 (-1.92; 5.40)
56.1 53.4 (9.4) (9.1)
3.88 (-0.03; 7.80)
Anxious/Depressed 55.0 54.4 0.21 (-1.90; 2.31) (5.1) (5.0)
59.0 58.2 (8.1) (8.4)
1.66 (-1.77; 5.10)
Withdrawn/Depressed 56.4 55.8 (5.6) (6.2)
0.68 (-1.78; 3.13)
62.4 62.0 -0.38 (-4.78; 4.02) (11.3) (10.3)
Somatic Complaints 57.2 58.1 -0.80 (-3.66; 2.07) (6.3) (7.3)
64.0 64.7 (8.8) (9.5)
-0.54 (-4.37; 3.29)
Social Problems 56.7 55.7 0.88 (-1.56; 3.32) (5.8) (6.1)
59.8 57.9 (9.7) (7.6)
1.59 (-2.00; 5.18)
Thought Problems 54.6 54.7 0.27 (-2.16; 2.70) (4.8) (6.6)
59.1 58.3 (7.3) (7.9)
1.61 (-1.55; 4.77)
Attention Problems 55.4 53.0 2.38 (0.29; 4.46) (5.9) (4.1)
58.5 55.4 (8.4) (5.3)
3.26 (0.42; 6.10)
Rule-Breaking 54.4 54.2 0.53 (-1.42; 2.47) Behaviour (4.6) (4.8)
56.7 55.8 (5.7) (6.2)
1.79 (-0.65; 4.23)
Aggressive Behaviour 54.2 54.5 (5.5) (7.5)
0.53 (-2.22; 3.28)
58.0 56.4 (8.4) (7.5)
2.58 (-0.70; 5.86)
1B (95% CI) adjusted for age, sex and BMI; bold type indicates p< 0.05
40
