
Page 117 - Go4it
P. 117
Fat-free mass
14 12 10
8 6 4 2 0
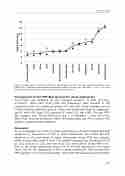
Figure 1: Percentage of accurate predictions, percentage bias, and root mean squared prediction error (RMSE) for 13 fat-free mass predictive equations in obese girls ■ (n=61) and boys □ (n=42). For each panel, the data are sorted by mean values of all adolescents (line).
Development of new FFM-BIA equation for obese adolescents
H(cm)2/Imp was identified as the strongest predictor of FFM (R2=0.82; p<0.0001). When both H(cm)2/Imp and bodyweight were included in the regression model, the explained variance (R2) was 92%. Other variables did not further improve explained variance, which was consistently high for subgroups: sex (R2 girls 0.89, boys 0.93), puberty (R2 early 0.92, late 0.89). The new FFM- BIA equation was: FFM=0.527H(cm)2/Imp + 0.306weight - 1.862 (R2=0.92, SEE=2.85). Accurate predictions within this study group was 76%, however this equation awaits external validation.
Discussion
To our knowledge this is the first study evaluating all relevant available BIA-FFM equations for assessment of FFM in obese adolescents. We ranked BIA-FFM equations in the percentage of obese adolescents whose FFM was assessed within a reasonable range of error. The equations proposed by Deurenberg’90 et al. (21), Gray et al. (22), and Kyle et al. (23) were able to assess FFM in 61- 68% of the obese adolescents within 5% of the DXA assessment. This study shows that for the assessment of FFM in obese adolescents, DXA and the BIA- FFM equations are not interchangeable. Some BIA-FFM equations perform better
117
Deurenberg'90 Kyle Gray Sun Lukaski Deurenberg'91 Houtkooper Haroun Lazzer Wabitsch Horie Schaefer Suprasongsin
RMSE FFM (Kg)
