
Page 24 - EVALUATION OF TREATMENT FOR HEAVY MENSTRUAL BLEEDING by Herman, Malou
P. 24
Chapter 7
We also used receiver operating characteristic (ROC) curve analysis to assess the diagnostic value of PBAC score for satisfaction or re-intervention. The area under the ROC curve (AUC) as well as the sensitivity and specificity at different PBAC scores were reported. The sensitivity and specificity of the best cut-off value (point closest to left corner of ROC curve) was also reported. As a sensitivity analysis, the ROC curve was also assessed using the aforementioned logistic regression models, in which we corrected for study by using the predictive probability. All statistical analyses were performed using IBM SPSS Statistics for Windows (version 21.0, Armonk: NY, IBM Corp).
Results
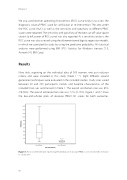
Nine trials, reporting on the individual data of 900 women, met our inclusion criteria and were included in this study (Table 1 9-17). Eight different second generation techniques were evaluated in the included studies. Study sizes varied between 30 and 209 participants. Details and baseline characteristics of the included trials are summarised in Table 1. The overall satisfaction rate was 89% (78-98%). The overall reintervention rate was 7.2% (0-19%). Figure 1 and 2 show the box-and-whisker plots of absolute PBAC12m scores for both outcomes.
1500 1350 1200 1050
900 750 600 450 300 150
0
Re-intervention
No re-intervention
Re-intervention
336 592
478
341
335
340
338 494
41
726 492 845 589 334
706 707 843 333
721 474 838
490
839
318
Figure 1: A box-and-whisker plot expressing the distribution of absolute PBAC score at 12 months in relation to satisfaction
86
PBAC12m
