
Page 34 - Age of onset of disruptive behavior of residentially treated adolescents -Sjoukje de Boer
P. 34
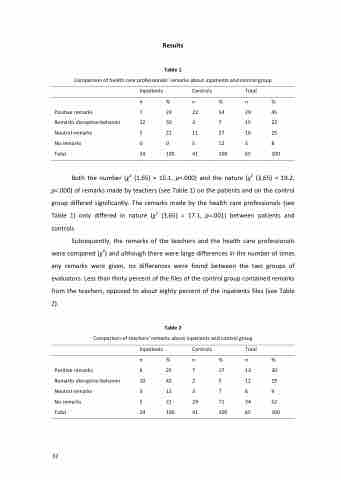
Results
Table 1
Comparison of health care professionals’ remarks about inpatients and control group
     Inpatients Controls Total n%n%n%
        Positive remarks
Remarks disruptive behavior Neutral remarks
No remarks
Total
7 29 22 54 12 50 3 7
5 21 11 27 0 0 5 12 24 100 41 100
29 45 15 23 16 25 58 65 100
 Both the number (χ2 (1,65) = 15.1, p=.000) and the nature (χ2 (3,65) = 19.2, p=.000) of remarks made by teachers (see Table 1) on the patients and on the control group differed significantly. The remarks made by the health care professionals (see Table 1) only differed in nature (χ2 (3,65) = 17.1, p=.001) between patients and controls.
Subsequently, the remarks of the teachers and the health care professionals were compared (χ2) and although there were large differences in the number of times any remarks were given, no differences were found between the two groups of evaluators. Less than thirty percent of the files of the control group contained remarks from the teachers, opposed to about eighty percent of the inpatients files (see Table 2).
Table 2
Comparison of teachers’ remarks about inpatients and control group Inpatients Controls   Total
            Positive remarks
Remarks disruptive behavior Neutral remarks
No remarks
Total
6 25 7 17 10 42 2 5
3 12 3 7
5 21 29 71 24 100 41 100
13 20 12 19 69 34 52 65 100
n%n%n%
 32
