
Page 26 - Microbial methane cycling in a warming world From biosphere to atmosphere Michiel H in t Zandt
P. 26
Chapter 1. General introduction
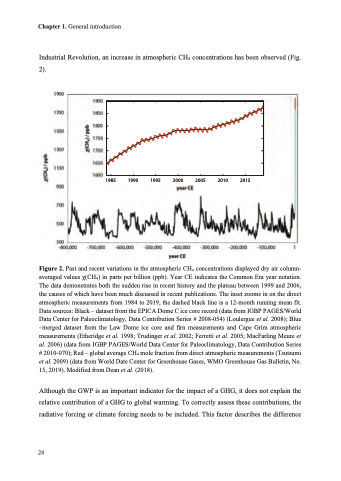
Industrial Revolution, an increase in atmospheric CH4 concentrations has been observed (Fig.
2).
Figure 2. Past and recent variations in the atmospheric CH4 concentrations displayed dry air column- averaged values χ(CH4) in parts per billion (ppb). Year CE indicates the Common Era year notation. The data demonstrates both the sudden rise in recent history and the plateau between 1999 and 2006, the causes of which have been much discussed in recent publications. The inset zooms in on the direct atmospheric measurements from 1984 to 2019, the dashed black line is a 12-month running mean fit. Data sources: Black – dataset from the EPICA Dome C ice core record (data from IGBP PAGES/World Data Center for Paleoclimatology, Data Contribution Series # 2008-054) (Loulergue et al. 2008); Blue –merged dataset from the Law Dome ice core and firn measurements and Cape Grim atmospheric measurements (Etheridge et al. 1998; Trudinger et al. 2002; Ferretti et al. 2005; MacFarling Meure et al. 2006) (data from IGBP PAGES/World Data Center for Paleoclimatology, Data Contribution Series # 2010-070); Red – global average CH4 mole fraction from direct atmospheric measurements (Tsutsumi et al. 2009) (data from World Date Center for Greenhouse Gases, WMO Greenhouse Gas Bulletin, No. 15, 2019). Modified from Dean et al. (2018).
Although the GWP is an important indicator for the impact of a GHG, it does not explain the relative contribution of a GHG to global warming. To correctly assess these contributions, the radiative forcing or climate forcing needs to be included. This factor describes the difference
24
119855 119900 119955 22000 220055 220100 220155
