
Page 207 - Microbial methane cycling in a warming world From biosphere to atmosphere Michiel H in t Zandt
P. 207
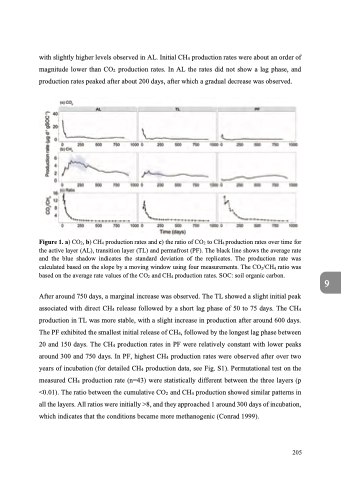
with slightly higher levels observed in AL. Initial CH4 production rates were about an order of magnitude lower than CO2 production rates. In AL the rates did not show a lag phase, and production rates peaked after about 200 days, after which a gradual decrease was observed.
Figure 1. a) CO2, b) CH4 production rates and c) the ratio of CO2 to CH4 production rates over time for the active layer (AL), transition layer (TL) and permafrost (PF). The black line shows the average rate and the blue shadow indicates the standard deviation of the replicates. The production rate was calculated based on the slope by a moving window using four measurements. The CO2/CH4 ratio was based on the average rate values of the CO2 and CH4 production rates. SOC: soil organic carbon.
9
  After around 750 days, a marginal increase was observed. The TL showed a slight initial peak associated with direct CH4 release followed by a short lag phase of 50 to 75 days. The CH4 production in TL was more stable, with a slight increase in production after around 600 days. The PF exhibited the smallest initial release of CH4, followed by the longest lag phase between 20 and 150 days. The CH4 production rates in PF were relatively constant with lower peaks around 300 and 750 days. In PF, highest CH4 production rates were observed after over two years of incubation (for detailed CH4 production data, see Fig. S1). Permutational test on the measured CH4 production rate (n=43) were statistically different between the three layers (p <0.01). The ratio between the cumulative CO2 and CH4 production showed similar patterns in all the layers. All ratios were initially >8, and they approached 1 around 300 days of incubation, which indicates that the conditions became more methanogenic (Conrad 1999).
205
