
Page 164 - Microbial methane cycling in a warming world From biosphere to atmosphere Michiel H in t Zandt
P. 164
Chapter 7. Methane cycling in Arctic thermokarst lake sediments
The incubation with H2/CO2 were active in the first 60 days but only produced substoichiometric amounts of CH4. The maximum Q10 coefficient, which corresponds to the rate change as a result of temperature increase, for TMA, acetate and the control incubations was detected after 98 days, with values of 9.8, 4.2 and 3.3 respectively. Final Q10 values were 0.9, 1.1 and 1.1 for TMA, acetate and the control. For the H2/CO2 incubation the maximum Q10 coefficient of 2.0 was obtained after 52 days. Cell-specific methanogenesis rates had only minor differences between 4°C and 10°C on acetate (8.1 and 7.7 fmol cell-1 day-1 for 4°C and 10°C respectively) and TMA (51 and 40 fmol cell-1 day-1 for 4°C and 10°C respectively) and are all in the range of previously observed methane production rates (Supplemental Table S6) (in ‘t Zandt et al. 2018). The qPCR data showed that the total archaeal 16S rRNA gene copy numbers increased in all methanogenic incubations compared to the control, except for H2/MeOH, consistent with the low CH4 production in this incubation (Table 2).
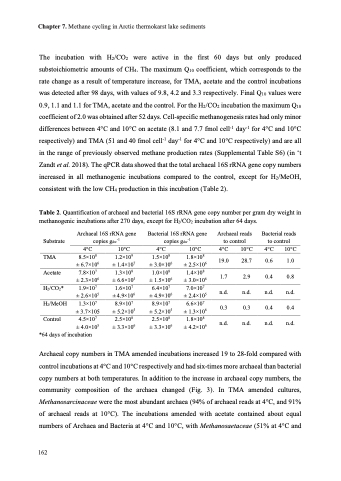
Table 2. Quantification of archaeal and bacterial 16S rRNA gene copy number per gram dry weight in methanogenic incubations after 270 days, except for H2/CO2 incubation after 64 days.
Substrate TMA Acetate H2/CO2* H2/MeOH Control
Archaeal 16S rRNA gene copies gdw-1
Bacterial 16S rRNA gene copies gdw-1
Archaeal reads to control
Bacterial reads to control
4°C 8.5×10⁸ ± 6.7×10⁶ 7.8×10⁷ ± 2.3×10⁶ 1.9×10⁷ ± 2.6×10⁵ 1.3×10⁷ ± 3.7×10⁵ 4.5×10⁷ ± 4.0×10⁵
10°C 1.2×10⁹ ± 1.4×10⁷ 1.3×10⁸ ± 6.6×10⁵ 1.6×10⁷ ± 4.9×10⁶ 8.9×10⁷ ± 5.2×10⁵ 2.5×10⁸ ± 3.3×10⁶
4°C 1.5×10⁸ ± 3.0×10⁶ 1.0×10⁸ ± 1.5×10⁶ 6.4×10⁷ ± 4.9×10⁶ 8.9×10⁷ ± 5.2×10⁵ 2.5×10⁸ ± 3.3×10⁶
10°C 4°C
10°C 4°C 10°C
28.7 0.6 1.0
2.9 0.4 0.8
n.d. n.d. n.d.
0.3 0.4 0.4
n.d. n.d. n.d.
1.8×10⁸ ± 2.5×10⁶ 1.4×10⁸ ± 3.0×10⁶ 7.0×10⁷ ± 2.4×10⁵ 6.6×10⁷ ± 1.3×10⁶ 1.8×10⁸ ± 4.2×10⁶
19.0 1.7 n.d. 0.3 n.d.
*64 days of incubation
Archaeal copy numbers in TMA amended incubations increased 19 to 28-fold compared with control incubations at 4°C and 10°C respectively and had six-times more archaeal than bacterial copy numbers at both temperatures. In addition to the increase in archaeal copy numbers, the community composition of the archaea changed (Fig. 3). In TMA amended cultures, Methanosarcinaceae were the most abundant archaea (94% of archaeal reads at 4°C, and 91% of archaeal reads at 10°C). The incubations amended with acetate contained about equal numbers of Archaea and Bacteria at 4°C and 10°C, with Methanosaetaceae (51% at 4°C and
162
