
Page 114 - Microbial methane cycling in a warming world From biosphere to atmosphere Michiel H in t Zandt
P. 114
Chapter 5. Early Holocene carbon storage and microbial activity in North Sea peats
Gundelach site has clay deposits capping the peat that are ±35 cm thick. At the other sites, the
clay deposits capping the peat layer range from 5 cm to 50 cm.
Low CH4 concentrations are widespread, high local concentrations occur
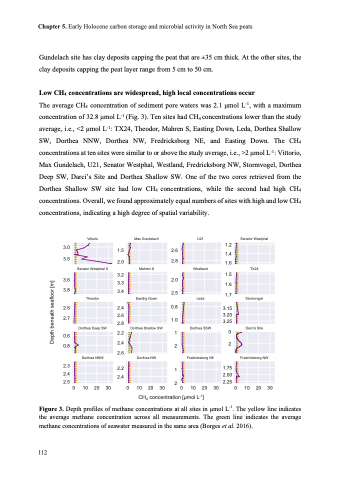
The average CH4 concentration of sediment pore waters was 2.1 μmol L-1, with a maximum concentration of 32.8 μmol L-1 (Fig. 3). Ten sites had CH4 concentrations lower than the study average, i.e., <2 μmol L-1: TX24, Theodor, Mahren S, Easting Down, Leda, Dorthea Shallow SW, Dorthea NNW, Dorthea NW, Fredricksborg NE, and Easting Down. The CH4 concentrations at ten sites were similar to or above the study average, i.e., >2 μmol L-1: Vittorio, Max Gundelach, U21, Senator Westphal, Westland, Fredricksborg NW, Stormvogel, Dorthea Deep SW, Darci’s Site and Dorthea Shallow SW. One of the two cores retrieved from the Dorthea Shallow SW site had low CH4 concentrations, while the second had high CH4 concentrations. Overall, we found approximately equal numbers of sites with high and low CH4 concentrations, indicating a high degree of spatial variability.
3.0 3.5
3.6 3.8
2.6 2.7
0.6 0.8
2.3 2.4
Vittorio
Senator Westphal S
Theodor
Dorthea Deep SW
Dorthea NNW
Max Gundelach
1.5 2.6
2.0 2.8 Mahren S
3.2
3.3 2.0
3.4 2.5 Easting Down
2.4 0.8
2.6 1.0 2.8
2.2 Dorthea Shallow SW 1
2.4 2
U21
Westland
Leda
1.2 1.4 1.6
1.5 1.6 1.7
3.15 3.20 3.25
Senator Westphal
TX24
Stormvogel
Darci's Site
Fredricksborg NW
2.6
Dorthea NW
Dorthea SSW 0 2
Fredricksborg NE
1.75 2.00
2.2 1 2.4
2.50 10 20 30
20 10 20 302.250 10 20 30
0 10 20 30
CH4 concentration [μmol L-1]
Figure 3. Depth profiles of methane concentrations at all sites in μmol L-1. The yellow line indicates the average methane concentration across all measurements. The green line indicates the average methane concentrations of seawater measured in the same area (Borges et al. 2016).
112
Depth beneath seafloor [m]
