
Page 127 - Diagnostic delay of endometriosis
P. 127
ranking of interventions submitted in the current round (the ‘no consensus’ and newly added interventions). Panel members were given the opportunity to clarify their response at the end of the questionnaire.
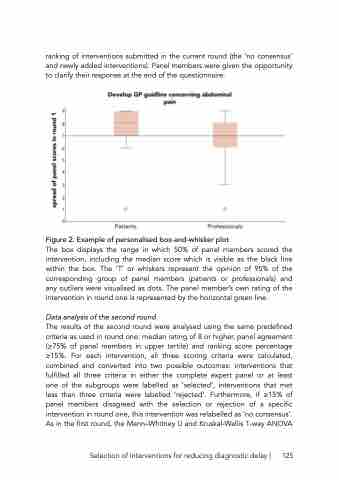
Figure 2. Example of personalised box-and-whisker plot
The box displays the range in which 50% of panel members scored the intervention, including the median score which is visible as the black line within the box. The ‘T’ or whiskers represent the opinion of 95% of the corresponding group of panel members (patients or professionals) and any outliers were visualised as dots. The panel member’s own rating of the intervention in round one is represented by the horizontal green line.
Data analysis of the second round
The results of the second round were analysed using the same predefined criteria as used in round one: median rating of 8 or higher, panel agreement (≥75% of panel members in upper tertile) and ranking score percentage ≥15%. For each intervention, all three scoring criteria were calculated, combined and converted into two possible outcomes: interventions that fulfilled all three criteria in either the complete expert panel or at least one of the subgroups were labelled as ‘selected’, interventions that met less than three criteria were labelled ‘rejected’. Furthermore, if ≥15% of panel members disagreed with the selection or rejection of a specific intervention in round one, this intervention was relabelled as ‘no consensus’. As in the first round, the Mann–Whitney U and Kruskal-Wallis 1-way ANOVA
Selection of interventions for reducing diagnostic delay | 125
