
Page 110 - Development of Functional Scaffolds for Bone Tissue Engineering Using 3D-Bioprinting of Cells and Biomaterials - Yasaman Zamani
P. 110
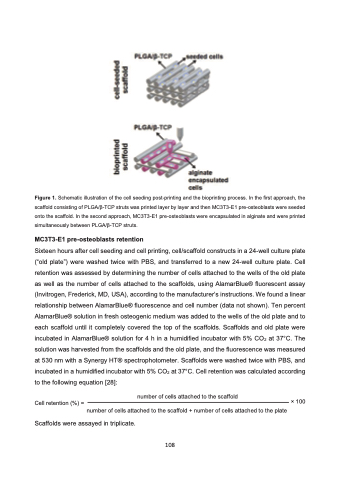
 Figure 1. Schematic illustration of the cell seeding post-printing and the bioprinting process. In the first approach, the scaffold consisting of PLGA/β-TCP struts was printed layer by layer and then MC3T3-E1 pre-osteoblasts were seeded onto the scaffold. In the second approach, MC3T3-E1 pre-osteoblasts were encapsulated in alginate and were printed simultaneously between PLGA/β-TCP struts.
MC3T3-E1 pre-osteoblasts retention
Sixteen hours after cell seeding and cell printing, cell/scaffold constructs in a 24-well culture plate (“old plate”) were washed twice with PBS, and transferred to a new 24-well culture plate. Cell retention was assessed by determining the number of cells attached to the wells of the old plate as well as the number of cells attached to the scaffolds, using AlamarBlue® fluorescent assay (Invitrogen, Frederick, MD, USA), according to the manufacturer’s instructions. We found a linear relationship between AlamarBlue® fluorescence and cell number (data not shown). Ten percent AlamarBlue® solution in fresh osteogenic medium was added to the wells of the old plate and to each scaffold until it completely covered the top of the scaffolds. Scaffolds and old plate were incubated in AlamarBlue® solution for 4 h in a humidified incubator with 5% CO2 at 37°C. The solution was harvested from the scaffolds and the old plate, and the fluorescence was measured at 530 nm with a Synergy HT® spectrophotometer. Scaffolds were washed twice with PBS, and incubated in a humidified incubator with 5% CO2 at 37°C. Cell retention was calculated according to the following equation [28]:
number of cells attached to the scaffold
number of cells attached to the scaffold + number of cells attached to the plate
× 100
  Cell retention (%) =
Scaffolds were assayed in triplicate.
  108
