
Page 107 - ADULT-ONSET ASTHMA PREDICTORS OF CLINICAL COURSE AND SEVERITY
P. 107
CLINICAL PREDICTORS OF REMISSION AND PERSISTENCE OF ADULT-ONSET ASTHMA
per step decrease in dose: Beta(SE)=0.99(0.39), p=0.005) and the presence of nasal polyps (Beta(SE)=2.96(1.47), p=0.001) were independent predictors of asthma persistence. The probability of asthma remission can be calculated by the following formula: x/(1+x), where x = e^(-4.75791+(nasal polyps*2.9419)+((Log10(PC20-Metacholine))*0.93938)). Thus, when applying this model to an imaginary pa ent with nasal polyps and PC20-methacholine of 1 mg/ml at the me of asthma diagnosis this would give a chance of less than 1% for asthma remission within the next 5 years (Figure 2).
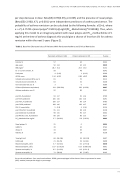
Table 1. Baseline Characteristics of Patients With Persistent Asthma and Clinical Remission.
Persistent asthma (n=143) Clinical remission (n=27)
P-value
0.243
0.039
0.132 0.342 0.266 0.026 0.212 0.248 0.389 0.007 0.561
0.709 0.291 0.785 0.107 0.134 0.158 0.562 0.527 0.003
0.004
0.763 0.667 0.138
0.497 0.698 0.038 0.601 0.688 0.143
Female, %
Age, years
BMI, kg/m2
Ex- or current smoker, % Pack years
ACQ-6 score
Inhaled corticosteroid (ICS) use, % ICS and second controlller, %
Oral corticosteroid use, %
ICS dose (fluticasone equivalent) Asthma medication use, %
pre FEV1 % predicted
pre FVC% predicted
post FEV1, % predicted
post FVC% predicted
FEV1 % reversibility
post FEV1/FVC, % predicted post DLCOcVA, % predicted post RV/TLC ratio, % predicted PC20-Methacholine mg/ml
57 44
50 ±14 44 28.2 ±5.2 26.5 58 48 4 (0-15) 1 1.34 ±0.92 0.89 81 70 64 52 3 0 313 (250-500) 250 92 89
93 ±17 95 106 ±16 102 100 ±17 99 108 ±16 103
5 (2-9) 4
±15 ±5.0
(0-12) ±0.67
(0-250)
±16 ±16 ±14 ±17 (2-6) ±10 ±17 ±13 (2.9-32)
(30-115) (12-44) (2.7-4.0) (0.08-0.26) (0.2-1.5) (71-87)
Nasal polyps, % 25 GERD, % 39 Atopy, % 44 Obesity, % 33
Total IgE, kU/L 68 (26-236) FeNO, ppb 21 (13-45)
Blood neutrophils, 109/L Blood eosinophils, 109/L Sputum eosinophils, % Sputum neutrophils, %
0 42 46 19
59
95 ±11 98 ±15 88 ±20
98 96 86
2.7 (0.8-6.6) 5.8
29 3.7 (3.0-4.6) 3.0 0.17 (0.1-0.28) 0.15 0.5 (0.1-3.8) 0.6 71 (50-84) 82
Pre: pre-bronchodilator. Post: post-bronchodilator. GERD: gastroesophageal reflux disease. Data are presented as mean (±SD), median (interquartile range) or percentage.
1
105
