
Page 99 - The SpeakTeach method - Esther de Vrind
P. 99
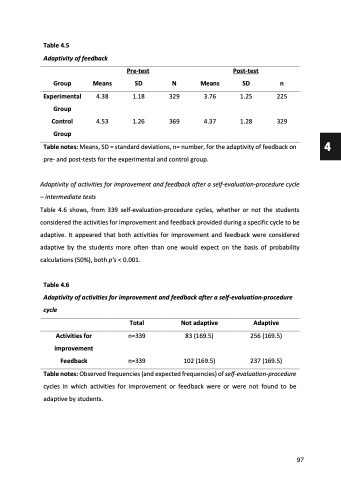
Table 4.5
Adaptivity of feedback
     Group Experimental Group Control Group
Pre-test
Means SD N
4.38 1.18 329
4.53 1.26 369
Post-test
Means SD n
3.76 1.25 225
4.37 1.28 329
          Table notes: Means, SD = standard deviations, n= number, for the adaptivity of feedback on pre- and post-tests for the experimental and control group.
Adaptivity of activities for improvement and feedback after a self-evaluation-procedure cycle – intermediate tests
Table 4.6 shows, from 339 self-evaluation-procedure cycles, whether or not the students considered the activities for improvement and feedback provided during a specific cycle to be adaptive. It appeared that both activities for improvement and feedback were considered adaptive by the students more often than one would expect on the basis of probability calculations (50%), both p’s < 0.001.
Table 4.6
Adaptivity of activities for improvement and feedback after a self-evaluation-procedure cycle
          Total Activities for n=339
improvement
Feedback n=339
Not adaptive
83 (169.5)
Adaptive
256 (169.5)
          102 (169.5)
Table notes: Observed frequencies (and expected frequencies) of self-evaluation-procedure
237 (169.5)
     cycles in which activities for improvement or feedback were or were not found to be adaptive by students.
97
97
 4
