
Page 75 - Preventing pertussis in early infancy - Visser
P. 75
Chapter 5
Quantitative study HCWs
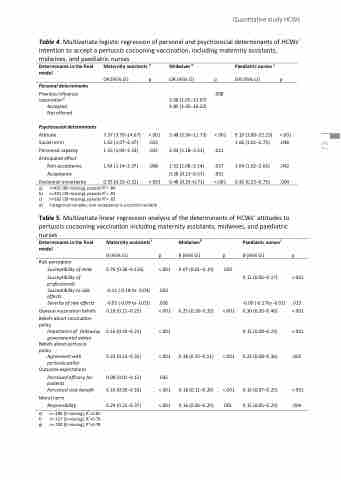
Table 4. Multivariate logistic regression of personal and psychosocial determinants of HCWs’ intention to accept a pertussis cocooning vaccination, including maternity assistants,
midwives, and paediatric nurses
Determinants in the final model
Personal determinants
Previous influenza vaccinationd
Accepted Not offered
Psychosocial determinants
Attitude
Social norm Perceived capacity Anticipated effect
Non-acceptance
Acceptance
Decisional uncertainty
a) n=401 (85 missing), pseudo R2= .84
b) n=301 (19 missing), pseudo R2= .82
c) n=182 (18 missing), pseudo R2= .82
d) Categorical variable, non-acceptance is a control variable
Maternity assistants a Midwives b
Paediatric nurses c
OR (95% CI)
9.19 (3.80–22.23) 1.66 (1.01–2.75)
1.64 (1.02–2.63) 0.42 (0.23–0.75)
OR (95% CI) p
7.37 (3.70–14.67) <.001 1.62 (1.07–2.47) .023 1.55 (1.04–2.33) .032
1.64 (1.14–2.37) .008
OR (95% CI)
p
p
<.001 .046
.042 .004
0.35 (0.23–0.52) <.001
4.85 (1.45–16.22)
5.48 (2.56–11.73) 2.04 (1.18–3.51)
1.52 (1.08–2.14) 0.28 (0.13–0.57) 0.48 (0.33–0.71)
<.001
.011
.017 .001 <.001
.008 5.08 (1.65–15.67)
Table 5. Multivariate linear regression analysis of the determinants of HCWs’ attitudes to pertussis cocooning vaccination including maternity assistants, midwives, and paediatric
nurses
Determinants in the final model
Risk perception
Susceptibility of child Susceptibility of
professionals Susceptibility to side effects
Severity of side effects
General vaccination beliefs Beliefs about vaccination policy
Importanceof following
governmental advice
Beliefs about pertussis policy
Agreement with
pertussis policy
Outcome expectations
Perceived efficacy for patients
Perceived cost-benefit
Moral norm
Maternity assistantsa
β (95% CI)
0.76 (0.36–0.116)
-0.11 (-0.18 to -0.04)
-0.05 (-0.09 to -0.01) 0.18 (0.11–0.25)
0.16 (0.10–0.21)
0.22 (0.13–0.31)
0.08 (0.01–0.15) 0.10 (0.05–0.16)
0.29 (0.21–0.37)
p
<.001
.002
.026 <.001
<.001
<.001
.035 <.001
<.001
Midwivesb
β (95% CI)
0.07 (0.01–0.13)
0.25 (0.18–0.32)
0.38 (0.25–0.51)
0.18 (0.11–0.26) 0.16 (0.06–0.25)
p .029
<.001
<.001
<.001 .001
Paediatric nursesc
β (95% CI)
0.12 (0.06–0.17)
-0.09 (-0.17to -0.01) 0.30 (0.20–0.40)
0.15 (0.08–0.23) 0.22 (0.08–0.36)
0.16 (0.07–0.25) 0.15 (0.05–0.25)
p <.001
.023 <.001
<.001 .002
<.001 .004
e) f) g)
Responsibility
n= 486 (0 missing), R2=0.82 n= 317 (3 missing), R2=0.79 n= 200 (0 missing), R2=0.78
75
73
