
Page 72 - Preventing pertussis in early infancy - Visser
P. 72
Chapter 5
70
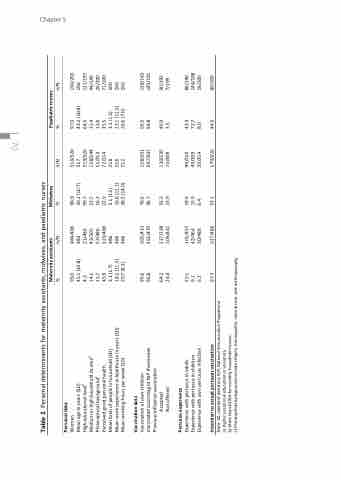
Table 2. Personal determinants for maternity assistants, midwives, and paediatric nurses Maternity assistants Midwives
Paediatric nurses
Personal data
99.6
45.1 (10.8) 4.3
14.1
11.7
45.9
3.3 (1.7) 18.2 (11.3) 20.7 (8.2)
484/486 96.9
483 39.2 21/486 99.7 43/305 52.5 57/486 16.3 223/486 22.9
486 3.1 (1.5) 486 16.6 (11.1)
310/320 97.0
317 43.2 (10.9) 319/320 64.5 128/244 31.4 51/313 13.0 72/314 35.5
318 3.2 (1.5) 316 23.1 (11.3)
194/200 196 127/197 44/140 26/200 71/200 200
Women
Mean age in years (SD)
High educational levela
Medium or high household incomeb
Philosophical backgroundc
Perceived good personal health
Mean total of people in household (SD)
Mean work experience in healthcare in years (SD) Mean working hours per week (SD)
(10.7)
Vaccination data
95.6 96.8
395/413 78.6 455/470 96.7
158/201 96.5 297/307 94.8
138/143 181/191
Vaccination of own children
Vaccinated according to NIP themselves Previous influenza vaccination
64.2 23.4
217/338 55.3 103/441 23.9
130/235 46.9 74/309 3.5
90/192 7/199
Accepted Not offered
Pertussis experience
90/310 43.9 49/309 72.7 20/314 8.0
86/196 144/198 16/200
Experience with pertussis in adults Experience with pertussis in children Experience with own pertussis infection
22.1 9.1 6.2
101/457 29.0 42/464 15.9 30/486 6.4
Intention to accept pertussis vaccination
327/486 53.1
170/320 44.5
89/200
67.3
c) Philosophical backgrounds include religion, homeopathy, natural cure, and anthroposophy
Note: SD, standard deviation; NIP, National Immunisation Programme a) Higher vocational education or university
b) More than €3050 for monthly household income.
% n/N %
n/N % n/N
486 38.5
(14.0)
312 26.6
(7.0)
200 200
72
