
Page 166 - Fluorescence-guided cancer surgery
P. 166
164
Chapter 10
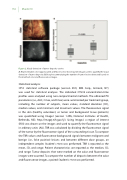
Figure 2. Visual detection of tumor deposits ex vivo
A. Representative color (upper panel) and uorescence (lower panel) images used to quantify the visual detection of tumor deposits. B. Box plot summarizing the number of tumor lesions detected based on the matched color and uorescence images.
Statistical analysis
SPSS statistical software package (version 20.0, IBM Corp., Armonk, NY) was used for statistical analyses. The individual OTL38 concentration-time pro les were analyzed using non-compartmental methods. The obtained PK parameters (i.e., AUC, Cmax, and tmax) were summarized per treatment group, including the number of subjects, mean values, standard deviation (SD), median values, and minimum and maximum values. The uorescence signal in the skin (healthy volunteers) or tumor and background tissue (patients) was quanti ed using ImageJ (version 1.49b, National Institutes of Health, Bethesda, MD; http://imagej.nih.gov/ij/). Using ImageJ, a region of interest (ROI) was drawn on the images and used to quantify the uorescence signal in arbitrary units (AU). TBR was calculated by dividing the uorescence signal of the tumor by the uorescence signal of the surrounding tissue. To compare the TBR values and uorescence background signals between malignant and benign (i.e., false positive) lesions and between di erent dose groups, an independent samples Student’s t-test was performed. TBR is reported as the mean, SD, and range. Patient characteristics are reported as the median, SD, and range. Tumor deposits that were marked on the color and uorescence images were counted. To compare the number of deposits between the color and uorescence images, a paired Student’s t-test was performed.
