
Page 98 - Sentinel lymph node biopsy in oral cavity cancer - Inne J. den Toom
P. 98
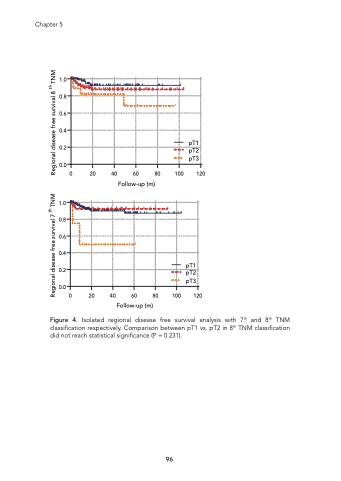
Chapter 5 1.0 0.8 0.6 0.4 0.2 0.0 1.0 0.8 0.6 0.4 0.2 0.0 Figure 4. Isolated regional disease free survival analysis with 7th and 8th TNM classification respectively. Comparison between pT1 vs. pT2 in 8th TNM classification did not reach statistical significance (P = 0.231). 0 20 40 60 80 100 120 Follow-up (m) 0 20 40 60 80 100 120 Follow-up (m) 96 pT1 pT2 pT3 pT1 pT2 pT3 Regional disease free survival 7 th TNM Regional disease free survival 8 th TNM
