
Page 95 - Sentinel lymph node biopsy in oral cavity cancer - Inne J. den Toom
P. 95
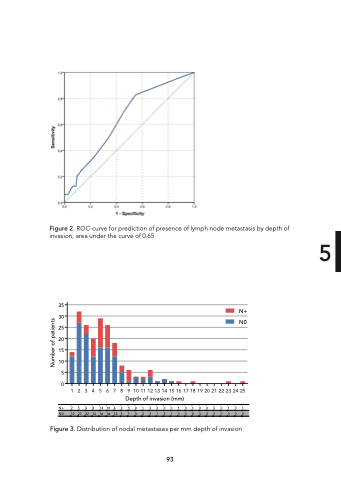
Figure 2. ROC-curve for prediction of presence of lymph node metastasis by depth of invasion, area under the curve of 0.65 35 30 25 20 15 10 5 0 N+ 2 5 4 8 13 10 6 3 5 0 1 3 0 0 0 1 0 1 0 0 0 0 1 0 1 N0 12 27 22 12 16 16 12 5 1 3 2 3 1 2 1 0 0 0 0 0 0 0 0 0 0 Figure 3. Distribution of nodal metastases per mm depth of invasion 93 5 N+ N0 1 2 3 4 5 6 7 8 9 10111213141516171819202122232425 Depth of invasion (mm) Number of patients
