
Page 85 - The value of total hip and knee arthroplasties for patients
P. 85
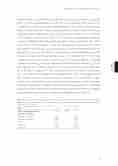
                                Scale
Total model (general factor) Separate constructs Treatment credibility Treatment expectancy
Hope Optimism Pessimism
ωk ωH 0,942 0,787
0,838 0,809 0,956 0,857 0,769
ωNk 0,789
0,782 0,015 0,329 0,769
Distinctiveness of Psychological Constructs
Further, a bifactor model in which (besides the 5 separate factors) there is a general
factor (gf) that is hypothesized to account for the commonality of the items of the
5 separate constructs was tested (Additional figure 3).This bifactor model showed
better fit indices than the 5 factor model and the four factor model in which the
expectancy and credibility items were forced to load on one factor (TLI = 0.99, CFI
= 0.99, RMSEA = 0.06, χ2 (df) = 304.6 (140)).The Δχ2 test indicated that the bifactor
model fit statistically significantly better than the five factor model (Δχ2 (df) = 86.8
(20) p<0.01). For the bifactor model we calculated the proportion of variance
accounted for by all factors (ωk), the proportion of variance accounted for by the
general factor (ωH). For each of the 5 separate factors we calculated the proportion
of variance unique from the general factor (ωNk) (for example see 31;38). For these
unique proportions of variance a value of ωNk ≥ 0.30 was regarded as substantial, 5 a value of 0 .20 ≤ ωNk <0.30 was regarded as moderate, and a value of ωNk <0 .20
was regarded low 38.Table 5 shows that the total amount of variance accounted for by all factors is large (0.94). Also, a substantial amount of variance of all factors (ωk) is accounted for by variation in the general factor (0.79).This suggest that all items indeed measure a common construct. However the specific factors differ in how much variance they account for unique from the general factor.Treatment expectancy, treatment credibility, optimism and pessimism explain a substantial amount of variance unique from the general factor, however hope does not explain a substantial amount of variance unique from the general factor (Table 5).
Table 5: the proportion of variance explained by all factors (ωk), the proportion of variance of the total scale explained by the general factor (ωH) and the proportion of variance of the separate constructs explained by the specific factors (ωNk)
   83
