
Page 82 - The value of total hip and knee arthroplasties for patients
P. 82
Chapter 5
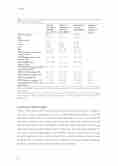
Table 2: characteristics of the sample included in this study and lambda 2 values for the subscales included in the Confirmatory Factor Analysis.
Total hip arthroplasty (N=182) mean (SD)/ %
58.1% 67.1 (9.9))
33.7% 32.0% 34.3%
27.5 (4.7) 38.8 (7.1)
51.8 (10.7)
41.9 (17.8)
43.8 (17.6)
23.7 (3.0) 22.5 (3.0) 43.2 (11.6) 9.9 (2.9) 10.8 (2.8)
*The THA patients completed the
questionnaire
HOOS =the Hip injury and Osteoarthris Outcome Score, KOOS=the Knee injury and Osteoarthritis Outcome Score, CEQ= Credibility Expectancy Questionnaire, HS= Hope Scale, LOT-R= Life Orientation Test Revised
Confirmatory factor analysis
Table 3 shows the model fit indices for the five, four, two and one factor models, as well as Δχ2 tests comparing the five factor model with the four factor model, the four factor model with the two factor model, and the two factor model with the one factor model.The five factor model showed fit indices that satisfied the cut-off criteria determined by Hu and Bentler21, whilst the models with four, two and one latent factor did not satisfy these criteria. Further, Δχ2 tests also indicated that the four factor model fit significantly worse than the five factor model, the two factor model fit significantly worse than the four factor model and the one factor model fit significantly worse than the two factor model.Thus, of the four models tested the five factor model is to be preferred based on all fit indices.
Gender % female
Age
Education level
Low Medium High
BMI
SF-36 Physical summary scale (range 0-100)
Sf-36 Mental summary scale (range 0-100)
HOOS/KOOS* pain (range 0 -100)
HOOS/KOOS* Activities of Daily Living (range 0-100)
CEQ Credibility (range 3-27)
CEQ Expectancy (range 3-27)
HS Hope (range 8-64)
LOT-R Optimism (range 3-15)
LOT-R Pessimism, reverse scored (range 3-15)
Total knee arthroplasty (N=179) mean (SD)/%
71.6% 67.6 (9.3)
50.3% 31.2% 18.5%
29.5 (4.8) 39.1 (7.7)
52.2 (11.2)
39.7 (16.7)
45.6 (17.6)
23.5 (3.1) 22.1 (3.0) 41.3 (11.8) 10.0 (2.8) 10.4 (2.7)
Total sample N=361 Mean (SD)/%
64.8% 67.4 (9.6)
42.0% 31.6% 26.4%
28.5 (4.9) 38.9 (7.4)
52.0 (10.9)
40.6 (17.2)
44.7 (17.5)
23.6 (3.1) 22.3 (3.0) 42.2 (11.7) 9.9 (2.8) 10.6 (2.8)
Gutmann’s lambda 2 for the total sample
- - -
- -
-
-
-
0.714 0.779 0.941 0.834 0.709
80
HOOS questionnaire and the TKA patients completed the KOOS
