
Page 106 - The value of total hip and knee arthroplasties for patients
P. 106
Chapter 6
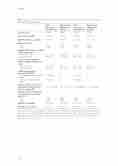
Table 1. Patient characteristics and baseline questionnaire scores for the current study population and the overall VESPA study population
Sex, Female; %
Age, mean years (SD)
Body Mass Index , mean (SD)
Education level; %
Low High
Baseline HOOS (THA) or KOOS (TKA)domain scores
ADL mean (SD) Pain mean (SD)
12 months post-op HOOS (THA) or KOOS (TKA)domain scores
ADL mean (SD) Pain mean (SD)
Credibility expectancy questionnaire (CEQ)
Subscale expectancy, median (IQR)
Subscale credibility, median (IQR)
HSS hip and knee replacement expectation surveys subscale function (range 0-24)
HSS hip and knee replacement expectation surveys subscale pain (%) #
Low High
SF36 MCS, mean (SD) SF36 PCS , mean (SD)
TKA Expectation study (N=146)
69.0% 66.9 (9.3) 29.5 (4.6)
76.1% 23.9%
46.1 (16.9) 39.4 (16.2)
83.9 (15.8) 83.6 (17.1)
23 (20;24) 24 (22;26)
19.0 (14.0;22.0)
76.1% 23.9%
52.8 (10.2) 39.4 (7.7)
TKA Overall VESPA study (N=322)
70.0% 66.9 (9.5) 29.5 (4.5)
73.5% 26.5%
48.8 (17.8) 41.7 (16.3)
83.0 (17.6) 83.7 (18.0)
n.a. n.a.
18.0 (14.0;21.0)
69.8% 30.2%
52.7(10.3) 40.4 (7.4)
THA Expectation study (N=148)
55.1% 67.5 (8.9) 27.0 (4.5)
48.1% 51.9%
46.2 (17.7) 43.9 (18.1)
84.3 (16.6) 88.2 (15.4)
23 (21;24) 24 (22;26)
21.0 (18.0;24.0)
42.4% 57.6%
51.4 (10.0) 39.9 (7.4)
THA Overall VESPA study (N=343)
57.0% 67.2 (9.5) 27.1 (4.4)
52.0% 48.0%
44.4 (17.6) 41.7 (18.2)
84.9 (17.0) 87.8 (15.4)
n.a. n.a.
21.0 (17.0;24.0)
43.8% 56.2%
51.0 (10.4) 39.9 (7.4)
HOOS= Hip injury and Osteoarthritis Outcome Score (HOOS), KOOS= Knee injury and Osteoarthritis Outcome Score (KOOS), CEQ=credibility expectancy questionnaire, HSS= hospital for special surgery expectation surveys, SF-36 MCS= short form 36 mental component summary, SF-36 PCS= short form 36 physical component summary
104
