
Page 164 - Cellular Imaging in Regenerative Medicine, Cancer and Osteoarthritis
P. 164
Chapter 7
Supplemental Data
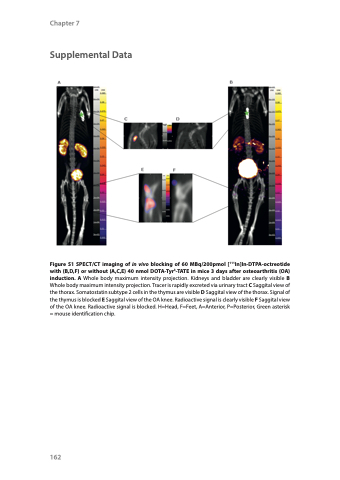
Figure S1 SPECT/CT imaging of in vivo blocking of 60 MBq/200pmol [111In]In-DTPA-octreotide with (B,D,F) or without (A,C,E) 40 nmol DOTA-Tyr3-TATE in mice 3 days after osteoarthritis (OA) induction. A Whole body maximum intensity projection. Kidneys and bladder are clearly visible B Whole body maximum intensity projection. Tracer is rapidly excreted via urinary tract C Saggital view of the thorax. Somatostatin subtype 2 cells in the thymus are visible D Saggital view of the thorax. Signal of the thymus is blocked E Saggital view of the OA knee. Radioactive signal is clearly visible F Saggital view of the OA knee. Radioactive signal is blocked. H=Head, F=Feet, A=Anterior, P=Posterior, Green asterisk = mouse identification chip.
162
