
Page 117 - Cellular Imaging in Regenerative Medicine, Cancer and Osteoarthritis
P. 117
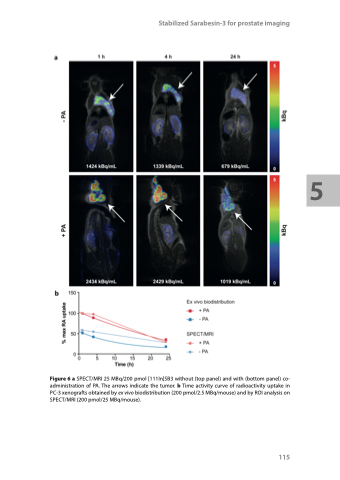
                                Stabilized Sarabesin-3 for prostate imaging
 Figure 6 a SPECT/MRI 25 MBq/200 pmol [111In]SB3 without (top panel) and with (bottom panel) co- administration of PA. The arrows indicate the tumor. b Time activity curve of radioactivity uptake in PC-3 xenografts obtained by ex vivo biodistribution (200 pmol/2.5 MBq/mouse) and by ROI analysis on SPECT/MRI (200 pmol/25 MBq/mouse).
115
5
