
Page 166 - Crossing Cultural Boundaries - Cees den Teuling
P. 166
No significant relations between other modes of organisational environment (“disruptive”, “laisser-faire”, “chaotic”) and degree of acceptance and readiness of implementation for new ideas and innovations have been determined.
The analysis also revealed that only progressive (p = .05) and chaotic (p = .035) organisational environments were significant determining factors with respect to the condition of being partly open in terms of new ideas to other employees and other departments. ANOVA F-ratio for the model (2.785) was slightly less than the expected value at that level of significance (2.92-2.99 with p = .01), which increases the chance that observed variances are incidental. In the meantime, progressive organisational environment affects to condition of being partly open in terms of new ideas to other employees and other departments in negative manner (b = -.279) and chaotic organisational environment affects it in a positive manner (b = .201).
No significant relations between other modes of organisational environment and the degree of acceptance and readiness of implementation of new ideas and innovations have been determined. The conducted ANOVA test also showed that the condition of not sharing innovations with outside world was affected by both disruptive (p = .034) and laisser-faire (p = .022) organisational environments.
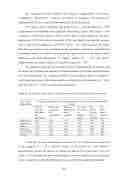
Table 20: Acceptance and readiness of implementation for new ideas and innovations Type of the Acceptance and readiness of implementation for new ideas and innovations,
organisation
Progressive Supportive Stabile Disruptive Laisser-faire Chaotic
Totally open for new ideas and innovation .002
.012 .038 .626 .331 .187
Partly open to others in the organisation
p-value We share
innovations with suppliers
We share We We
.005 .011 .079 .078 .413 .764 .168 .600 .436 .454 .035 .652
prefer don’t our way share do the innovati business ons
innovatio
ns
through
media
.052 .083 .228 .140 .790 .104 .141 .178 .155 .033 .089 .034 .019 .875 .022 .497 .776 .517
In the first case the relationship was positive (b = .215) while in the second case it was negative (b = -.272). ANOVA F-ratio for the model was 2.947 which is approximately equal to the value to be expected at that level of significance (2.92-2.99 with p = .01). Therefore, the observed differences cannot be considered as not incidental and we cannot be sure that the differences were caused by the independent variable.
11686
