
Page 88 - Effective healthcare cost containment policies Using the Netherlands as a case study - Niek W. Stadhouders
P. 88
Chapter 4
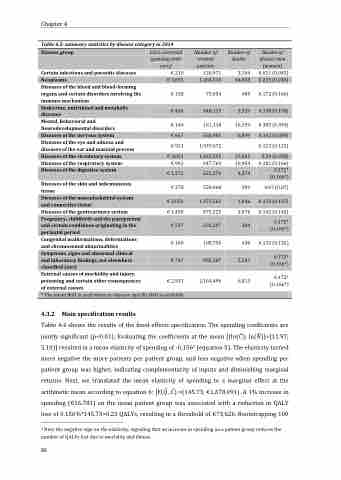
Table 4.3: summary statistics by disease category in 2014
Disease group
LYoL corrected spending (mln euro)
Number of treated patients
Number of deaths
Burden of
€ 210
Neoplasms € 3,655 1,284,510 44,808 0.225 (0.246)
Diseases of the blood and blood-forming organs and certain disorders involving the immune mechanism
Certain infectious and parasitic diseases
3,104 0.051 (0.045) € 140 161,118 10,193 0.385 (0.394)
120,971
€ 138 73,034 485 0.172 (0.166)
disease men
(women)
Endocrine, nutritional and metabolic
diseases
€ 436
348,113
3,529
0.198 (0.198)
Mental, Behavioral and
Neurodevelopmental disorders
Diseases of the nervous system € 667 568,905 6,849 0.162 (0.089) Diseases of the eye and adnexa and
diseases of the ear and mastoid process
Diseases of the circulatory system € 3,051 1,432,255 37,862 0.29 (0.288) Diseases of the respiratory system € 992 647,769 10,454 0.181 (0.166)
€ 921 1,937,672 . 0.123 (0.123)
Diseases of the digestive system
€ 1,272
622,379
4,374
0.172* (0.166*)
€ 278 528,068 309 0.07 (0.07)
€ 1,450 873,525 3,076 0.142 (0.142) € 597 292,207 384
6,813
Diseases of the skin and subcutaneous tissue
Diseases of the genitourinary system
Congenital malformations, deformations and chromosomal abnormalities
External causes of morbidity and injury,
poisoning and certain other consequences
of external causes
* The mean BoD is used when no disease specific BoD is available
108,750 2,164,496
430 0.132 (0.132)
0.172* (0.166*)
Diseases of the musculoskeletal system and connective tissue
€ 2,050
1,375,562
1,046
0.159 (0.137)
0.172* (0.166*)
Pregnancy, childbirth and the puerperium
and certain conditions originating in the perinatal period
€ 180
€ 747 983,587 5,507
0.172* (0.166*)
Symptoms, signs and abnormal clinical
and laboratory findings, not elsewhere classified (nec)
Table 4.4 shows the results of the fixed effects specification. The spending coefficients are jointly significant (p<0.01). Evaluating the coefficients at the mean [(ln( ); ln( ))=(11.97; 5.10)] resulted in a mean elasticity of spending of -0,1562 (equation 5). The elasticity turned more negative the more patients per patient group, and less negative when spending per patient group was higher, indicating complementarity of inputs and diminishing marginal returns. Next, we translated the mean elasticity of spending to a marginal effect at the arithmetic mean according to equation 6: [F( , ) =(145.73, €1,678,091). A 1% increase in spending (€16.781) on the mean patient group was associated with a reduction in QALY loss of 0.156%*145.73=0.23 QALYs, resulting in a threshold of €73,626. Bootstrapping 100
4.3.2 Main specification results
2 Note the negative sign on the elasticity, signaling that an increase in spending on a patient group reduces the number of QALYs lost due to mortality and illness.
80
€ 2,931
