
Page 73 - Effective healthcare cost containment policies Using the Netherlands as a case study - Niek W. Stadhouders
P. 73
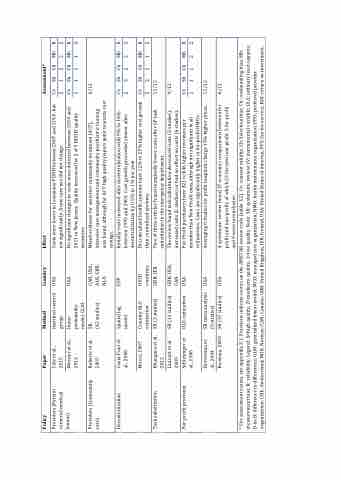
                                                                                                                                                                                                                            Providers (Patient centered medical homes)
Cole et al., 2015 Werner et al., 2013
matched control group
linear probability model, GLM
USA USA
Costs were lower in Louisiana PCMH between 2007 and 2010, but not significantly. Acute care use did not change.
No significant changes in costs were detected between 2010 and 2011 in New Jersey. Quality increased for 2 of 9 HEDIS quality measures.
Cv Sb 21 Cv Sb 11
R 2
Policy
Paper
Method
Country
Effect
Assessment*
Providers (Community care)
Roberts et al., 2005
SR
(42 studies)
CAN, USA, AUS, GBR, NLD
Mixed evidence for assertive community treatment (ACT), intensive case management and community psychiatric nursing was found, although for ACT high quality papers point towards cost savings.
Initially costs increased after decentralization with 9% to 16% between 1995 and 2002. Cost growth proceeded slower after decentralization by 0.5% to 1% per year.
Decentralized health systems have 12% to 25% higher cost growth than centralized systems.
Two of three articles found marginally lower costs after GP task substitution in the emergency department.
The review found task substitution decreased costs (3 studies), increased costs (2 studies) or had no effect on costs (6 studies). For-Profit purchasers have $21 to $46 higher revenues per member than Non-Profit ones, although not significant in all estimations. Costs are significantly higher in for-profit HMOs. Averaging 8 studies for profit hospitals charge 19% higher prices.
6/12
Decentralization
Costa-Font et al., 2008
Spatial lag model
ESP
Cv Sb 23
Cb Mb R 2 2 3
Task substitution For-profit provision
Mosca, 2007
Country OLS estimation
SR (3 studies)
OECD countries GBR, IER
Cv Sb 22 11/12
Cb Mb R 1 1 2
Khangura et al. 2012
Laurant et al. 2009 Schlesinger et al., 1986
SR (11 studies) OLS estimation
GBR, USA, CAN
USA
9/12
Cb Mb R 1 2 2
Devereaux et al., 2004 Rosenau, 2003
SR meta analysis (8 studies)
SR (37 studies)
USA USA
A systematic review found 37 economic comparisons between for profit and non-profit, of which 23 favored non-profit, 5 for-profit and 9 were inconclusive.
11/12 6/12
* For assessment scores, see appendix 3.1. Fractions indicate scores on the AMSTAR review scale (table 3.2). Cv: content validity, Sb: Selection bias; Cb: confounding bias; Mb: measurement bias; R: reliability. Legend: 3=high quality, 2=mediocre quality, 1=low quality. Note: SR: systematic review; IV: instrumental variable; OLS: ordinary least squares; D-in-D: difference in differences; GLM: generalized linear model; MCO: managed care organization; HMO: health maintenance organization; PPO: preferred provider organization; CHE: Switzerland; NOR: Norway; CAN: Canada; GBR: United Kingdom, IER: Ireland, USA: United States of America; FFS: fee for service; ROI: return on investment.
Cv Sb 11
Cb Mb
2 2
Cb Mb R 1 1 3
