
Page 70 - Effective healthcare cost containment policies Using the Netherlands as a case study - Niek W. Stadhouders
P. 70
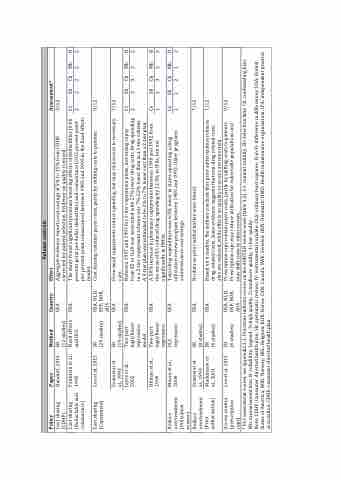
                                                                                                                                                                                                      Cost sharing (CDHP)
Cost sharing (Deductable and coinsurance)
Bundorf, 2016
SR
(12 studies) Fixed effects and OLS
USA USA
Volume controls
Effect Assessment*
Aggregate evidence reports cost savings of 5% to 15% from CDHP, 3/12
corrected for patient selection. Evidence on quality is mixed.
The study found significant premium lowering effects of deductibles (0.06 Cv Sb Cb Mb R percent point per dollar deductible) and coinsurance (0.02 percent point 2 2 2 2 2 per percent point coinsurance) between 1985 and 1992 in the fixed effects
model.
Cost sharing contains payer costs, partly by shifting costs to patients. 9/12
Policy
Paper
Method
Country
Cost sharing (Copayment)
Lee et al. 2015
SR
(29 studies)
Even small copayments reduce spending, but may risk access to necessary 7/12
care.
Between 1997 and 1999 for 1-tier copayment plans, increasing copay Cv Sb Cb Mb R from $5 to %10 was associated with 27% lower drug costs. Drug spending 2 3 3 3 2 in a 2-tier copayment scheme was 7%-22% lower than in a 1-tier scheme.
A 3-tier plan was estimated to be 2% to 7% lower cost than a 2-tier plan.
A 50% increase in pharmacy copayments between 1990 and 1992 from Cv Sb Cb Mb R the mean of $5 reduced drug spending by 12.3% in IPAs, but not 1 2 3 2 3 significantly in HMOs.
Total drug expenditure was 6.5% lower in states operating a drug Cv Sb Cb Mb R utilization review program between 1985 and 1992. Older programs 22 2 1 2 achieved more cost savings.
Reduce overtreatment (Utilization review) Reduce overtreatment (Prior authorization)
Hilman et al., 1999
USA USA
Feldstein et al., 1995
USA, NLD, ESP, NOR, AUS
USA
Soumerai et al., 1993 Joyce et al., 2002
SR
(19 studies) Two-part logit/linear regression model Two-part logit/linear regression OLS regression
USA
Moore et al., 2000
USA USA
No data on prior authorization were found. 7/12
Soumerai et al., 1993 Mackinnon et al., 2001
SR
(0 studies) SR
(6 studies)
Based on 6 studies, the authors conclude that prior authorization reduces 7/12 drug-related costs. Some evidence suggests that non-drug related costs
also are reduced, while effects on quality or access are uncertain.
Prescription caps contain payer costs, partly by shifting costs to patients. 9/12 Prescription caps may reduce utilization for vulnerable populations and
Access control
(prescription
caps)
* For assessment scores, see appendix 3.1. Fractions indicate scores on the AMSTAR review scale (table 3.2). Cv: content validity, Sb: Selection bias; Cb: confounding bias; Mb: measurement bias; R: reliability. Legend: 3=high quality, 2=mediocre quality, 1=low quality
Lee et al. 2015
SR
(6 studies)
USA, NLD, ESP, NOR, AUS
may shift costs to other sectors.
Note: CDHP: Consumer directed health plan; SR: systematic review; IV: instrumental variable; OLS: ordinary least squares; D-in-D: difference in differences; USA: United States of America; NOR: Norway; BEL: Belgium; KOR: Korea; CAN: Canada; SWE: Sweden; DEN: Denmark; HMO: Health maintenance organization; IPA: independent practice association; CDHP: consumer-directed health plan.
