
Page 42 - Effective healthcare cost containment policies Using the Netherlands as a case study - Niek W. Stadhouders
P. 42
Chapter 2
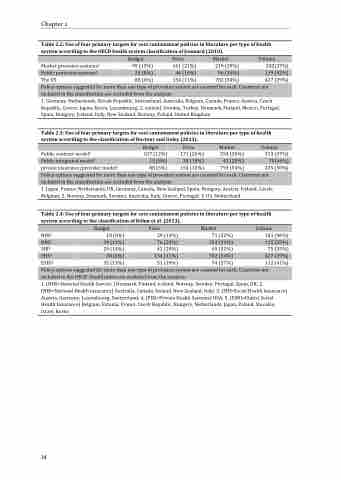
Table 2.2: Use of four primary targets for cost containment policies in literature per type of health system according to the OECD health system classification of Joumard (2010).
Budget Price Market Volume Market provision systems1 99 (13%) 161 (21%) 219 (29%) 282(37%) Public provision systems2 24 (8%) 46 (16%) 96 (34%) 119 (42%) The US 88 (6%) 154 (11%) 782 (54%) 427 (29%)
Policy options suggested for more than one type of provision system are counted for each. Countries not included in the classification are excluded from the analysis.
1. Germany, Netherlands, Slovak Republic, Switzerland, Australia, Belgium, Canada, France, Austria, Czech Republic, Greece, Japan, Korea, Luxembourg; 2. Iceland, Sweden, Turkey, Denmark, Finland, Mexico, Portugal, Spain, Hungary, Ireland, Italy, New Zealand, Norway, Poland, United Kingdom
Table 2.3: Use of four primary targets for cost containment policies in literature per type of health system according to the classification of Docteur and Oxley (2013).
Budget Price Market Volume Public contract model1 107 (12%) 171 (20%) 254 (30%) 313 (37%) Public integrated model2 13 (8%) 28 (18%) 43 (28%) 70(46%) private insurance/provider model3 88 (6%) 154 (10%) 793 (54%) 435 (30%)
Policy options suggested for more than one type of provision system are counted for each. Countries not included in the classification are excluded from the analysis.
1. Japan, France, Netherlands, UK, Germany, Canada, New Zealand, Spain, Hungary, Austria, Ireland, Czech, Belgium; 2. Norway, Denmark, Sweden, Australia, Italy, Greece, Portugal; 3. US, Switzerland
Table 2.4: Use of four primary targets for cost containment policies in literature per type of health system according to the classification of Böhm et al. (2013).
Budget Price Market Volume
NHS1 18 (8%) 29 (13%) 71 (32%) 101 (46%) NHI2 39 (12%) 76 (23%) 103 (31%) 115 (35%) SHI3 29 (14%) 42 (20%) 69 (32%) 75 (35%) PHS4 88 (6%) 154 (11%) 782 (54%) 427 (29%) ESHI5 35 (13%) 51 (19%) 74 (27%) 112 (41%) Policy options suggested for more than one type of provision system are counted for each. Countries not included in the OECD classification are excluded from the analysis.
1. (NHS=National Health Service ) Denmark, Finland, Iceland, Norway, Sweden, Portugal, Spain, UK; 2. (NHI=National Health insurance) Australia, Canada, Ireland, New Zealand, Italy; 3. (SHI=Social Health Insurance) Austria, Germany, Luxembourg, Switzerland; 4. (PHS=Private Health Systems) USA; 5. (ESHI=Etatist Social Health Insurance) Belgium, Estonia, France, Czech Republic, Hungary, Netherlands, Japan, Poland, Slovakia, Israel, Korea
34
