
Page 32 - Effective healthcare cost containment policies Using the Netherlands as a case study - Niek W. Stadhouders
P. 32
Chapter 2
(CPB, 2015), providing an overview of cost containment policies that covers the entire spectrum of political ideologies. Two researchers independently categorized the cost containment options from these two sources (Given, 2008).
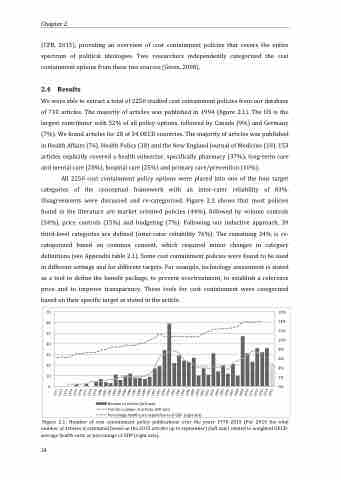
We were able to extract a total of 2250 studied cost containment policies from our database of 710 articles. The majority of articles was published in 1994 (figure 2.1). The US is the largest contributor with 52% of all policy options, followed by Canada (9%) and Germany (7%). We found articles for 28 of 34 OECD countries. The majority of articles was published in Health Affairs (76), Health Policy (38) and the New England Journal of Medicine (18). 153 articles explicitly covered a health subsector, specifically pharmacy (37%), long-term care and mental care (28%), hospital care (25%) and primary care/prevention (10%).
2.4 Results
All 2250 cost containment policy options were placed into one of the four target categories of the conceptual framework with an inter-rater reliability of 83%. Disagreements were discussed and re-categorized. Figure 2.2 shows that most policies found in the literature are market oriented policies (44%), followed by volume controls (34%), price controls (15%) and budgeting (7%). Following our inductive approach, 39 third-level categories are defined (inter-rater reliability 76%). The remaining 24% is re- categorized based on common consent, which required minor changes in category definitions (see Appendix table 2.1). Some cost containment policies were found to be used in different settings and for different targets. For example, technology assessment is stated as a tool to define the benefit package, to prevent overtreatment, to establish a reference price and to improve transparency. These tools for cost containment were categorized based on their specific target as stated in the article.
70 16%
60 50 40 30 20 10
0
14% 12% 10% 8% 6% 4% 2% 0%
Number of articles (left axis)
Trend in number of articles (left axis)
Figure 2.1: Number of cost containment policy publications over the years 1970-2015 (For 2015 the total number of articles is estimated based on the 2015 articles up to september) (left axis) related to weighted OECD- average health costs as percentage of GDP (right axis).
24
Percentage health care expenditures of GDP (right axis)
