
Page 179 - Effective healthcare cost containment policies Using the Netherlands as a case study - Niek W. Stadhouders
P. 179
General Discussion
depends on the amount of other new technologies that enter the benefit package that year as well as the stringency of that year’s budget. Because new technologies are generally only assessed once and in isolation, a supply-side opportunity cost approach to a new technology assessment may not result in socially optimal decisions. Instead, a demand-side threshold might be preferred as being more stable over time.
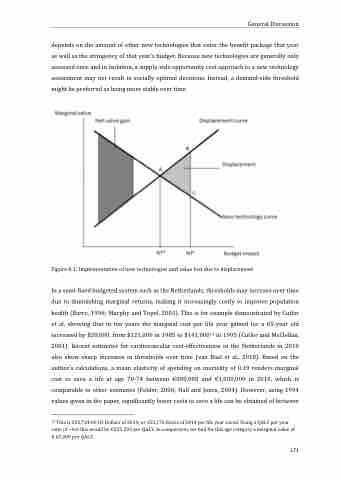
Figure 8.1: Implementation of new technologies and value lost due to displacement
In a semi-fixed budgeted system such as the Netherlands, thresholds may increase over time due to diminishing marginal returns, making it increasingly costly to improve population health (Barro, 1996; Murphy and Topel, 2003). This is for example demonstrated by Cutler et al, showing that in ten years the marginal cost per life year gained for a 65-year old increased by $20,000, from $121,000 in 1985 to $141,00014 in 1995 (Cutler and McClellan, 2001). Recent estimates for cardiovascular cost-effectiveness in the Netherlands in 2010 also show sharp increases in thresholds over time (van Baal et al., 2018). Based on the author’s calculations, a mean elasticity of spending on mortality of 0.19 renders marginal cost to save a life at age 70-74 between €800,000 and €1,000,000 in 2010, which is comparable to other estimates (Felder, 2006; Hall and Jones, 2004). However, using 1994 values given in the paper, significantly lower costs to save a life can be obtained of between
14 This is 203,724.08 US Dollars of 2014, or 153,176 Euros of 2014 per life year saved. Using a QALY per year ratio of ~0.6 this would be €255,293 per QALY. In comparison, we find for this age category a marginal value of
€ 65,000 per QALY.
171
