
Page 163 - Effective healthcare cost containment policies Using the Netherlands as a case study - Niek W. Stadhouders
P. 163
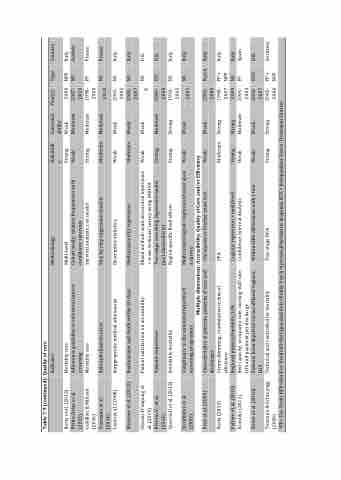
                                                                                                                                                                                                                                                                   Table 7.9 (continued): Quality of care
Berta et al. (2013) Britto-Arias et al. (2015)
Gobillon & Milcent (2016)
Mortality rate
Adherence guideline in colorectal cancer screening
Mortality rate
Multi-level
Cohort study, relative frequencies with confidence intervals
Survival analysis: cox model
2009 NFP 2007- NS
Italy Austria
Gusmano et al. (2014).
Louis et al. (2008).
Rehospitalization rates
Descriptive statistics
2010 NS
Moscone et al. (2012)
Readmission and death within 30 days
Mixed method: semi-structured interviews + cross sectional survey using ANOVA Two-stage switching regression model (incl. fixed effects)
2005- NS 2007 NS
Owusu-Frimpong et al. (2010)
Pérotin V., et al. (2013)
Patient satisfaction on accessibility
X
Quercioli et al. (2013)
Avoidable mortality
Region-specific fixed effects
1993- NS 2003 NS
Stroffolini, et al. (2003).
Compliance to the antenatal hepatitis B
screening programme
discharges Multiple dimensions: Accessibility, Quality of Care and/or Efficiency
Weak
2001
Preti et al. (2009) Berta (2010)
Characteristics of patients, patterns of care and
Chi-square or Fischer exact test SFA
Weak
Strong
2001- Psych. 2005
Italy
Fattore et al. (2014) Kondilis (2011)
Logistic regression + multilevel Confidence Interval Analysis
Strong Weak
2001- FP 2003
Italy Spain
Street et al. (2010).
Patients from deprived versus affluent regions, LOS
Technical and controlled for mortality
Within-HRG differences with t-test
Weak
Weak
2006- ISTC
U.K. Germany
Indicator
Methodology
Reliabilit y
Strong Weak
Generaliz ability Weak Moderate
Year(s) Type
Country
Inappropriate medical admissions
Multivariate OLS regression
2001- NS 2005
Patients experience
2007- ITC 2008
Cream skimming, readmission technical efficiency
Regional physical mobility, LOS
Bed capacity, occupancy rate, nursing staff rate, LOS and payment per discharge
Moderate
Strong Moderate
1998- FP+ 2007 NFP 2009 NS
Italy
Step by step regression models
2003
Multivariate logistic regression based upon a survey
Strong
*FP= For-Profit NFP=Not-For-Profit NS=Not Specified Pub.=Public Psych.=(private)Psychiatric hospitals ISTC= Independent Sector Treatment Centres
Tiemann & Schreyogg (2009)
Two stage DEA
Strong
2006 NFP
Strong Moderate Weak Moderate Weak Strong Strong Weak
Moderate Moderate Weak Weak Weak Moderate Strong Weak
2013 1998- FP
France France Italy Italy U.K. U.K. Italy Italy
2007
2002- FP+
