
Page 109 - Effective healthcare cost containment policies Using the Netherlands as a case study - Niek W. Stadhouders
P. 109
Do managed competition and active purchasing go hand in hand?
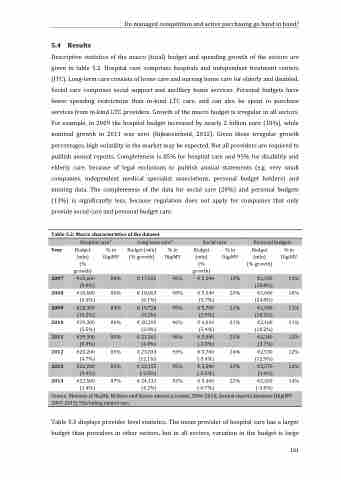
Descriptive statistics of the macro (total) budget and spending growth of the sectors are given in table 5.2. Hospital care comprises hospitals and independent treatment centers (ITC). Long-term care consists of home care and nursing home care for elderly and disabled. Social care comprises social support and ancillary home services. Personal budgets have fewer spending restrictions than in-kind LTC care, and can also be spent to purchase services from in-kind LTC providers. Growth of the macro budget is irregular in all sectors. For example, in 2009 the hospital budget increased by nearly 2 billion euro (10%), while nominal growth in 2011 was zero (Rijksoverheid, 2012). Given these irregular growth percentages, high volatility in the market may be expected. Not all providers are required to publish annual reports. Completeness is 85% for hospital care and 95% for disability and elderly care, because of legal exclusions to publish annual statements (e.g. very small companies, independent medical specialist associations, personal budget holders) and missing data. The completeness of the data for social care (20%) and personal budgets (13%) is significantly less, because regulation does not apply for companies that only provide social care and personal budget care.
5.4 Results
Hospital care* Long term care* Social care Personal Year Budget % in Budget (mln) % in Budget % in Budget
budgets % in
Table 5.2: Macro characteristics of the dataset
2007
(mln) DigiMV (% growth) DigiMV (mln) DigiMV (mln) (% (% (% growth)
DigiMV
growth) growth)
€15,600 88% € 17,025 96% € 5,240 18% €1,330
11% 10% 11% 11% 12% 12% 12% 14%
(0.0%) (18.8%) 2008 €16,600 86% € 18,063 98% € 5,540 20% €1,660 (6.4%) (6.1%) (5.7%) (24.8%) €18,300 83% € 19,728 95% € 5,700 21% €1,960 (10.2%) (9.2%) (2.9%) (18.1%) 2010 €19,300 86% € 20,295 96% € 6,010 21% €2,160 (5.5%) (2.9%) (5.4%) (10.2%) €19,300 85% € 21,261 96% € 5,900 23% €2,240 (0.0%) (4.8%) (-1.8%) (3.7%) 2012 €20,200 85% € 23,833 93% € 5,700 24% €2,530 (4.7%) (12.1%) (-3.4%) (12.9%) €22,200 85% € 23,155 95% € 5,500 23% €2,570 (9.9%) (-2.8%) (-3.5%) (1.6%) 2014 €22,500 87% € 24,131 92% € 5,460 22% €2,420 (1.4%) (4.2%) (-0.7%) (-5.8%)
2009
2011
2013
Source: Ministry of Health, Welfare and Sports annual accounts, 2006-2016; Annual reports database (DigiMV 2007-2015) *Excluding mental care
Table 5.3 displays provider level statistics. The mean provider of hospital care has a larger budget than providers in other sectors, but in all sectors, variation in the budget is large
101
