
Page 101 - Effective healthcare cost containment policies Using the Netherlands as a case study - Niek W. Stadhouders
P. 101
The marginal benefits of healthcare spending in the Netherlands
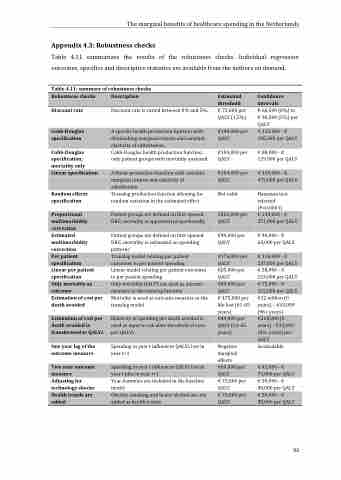
Table 4.11 summarizes the results of the robustness checks. Individual regression outcomes, specifics and descriptive statistics are available from the authors on demand.
Table 4.11: summary of robustness checks
Discount rate
Cobb-Douglas specification, mortality only
Random effects specification
Estimated multimorbidity correction
Linear per patient specification
Estimation of cost per death avoided
One year lag of the outcome measure
Adjusting for technology shocks
Appendix 4.3: Robustness checks
Robustness checks
Description
Estimated threshold
Confidence intervals
Discount rate is varied between 0% and 5%. € 73,600 per € 66,500 (0%) to
Cobb-Douglas
A specific health production function with €140,000 per € 113,000 - € diminishing marginal returns and constant QALY 185,000 per QALY elasticity of substitution.
Cobb-Douglas health production function, €104,000 per €88,000-€
QALY (1,5%) € 90,200 (5%) per QALY
specification
Linear specification
only patient groups with mortality analyzed QALY 129,000 per QALY
A linear production function with constant €184,000 per € 115,000 - € marginal returns and elasticity of QALY 472,000 per QALY
substitution
Translog production function allowing for Not valid Hausman test random variation in the estimated effect rejected
Proportional multimorbidity correction
(P<0.0001) Patient groups are defined on first opened €201,000 per € 143,000 - €
DRG, mortality is appointed proportionally QALY 271,000 per QALY
Patient groups are defined on first opened €49,600 per €46,000-€
DRG, mortality is estimated on spending QALY 63,000 per QALY patterns
Translog model relating per patient €176,000 per € 116,000 - € outcomes to per patient spending QALY 237,000 per QALY Linear model relating per patient outcomes €85.000 per € 58,000 - €
to per patient spending QALY 153,000 per QALY Only mortality QALYS are used as oucome €89.000 per € 75,000 - € measure in the translog function QALY 102,000 per QALY Mortality is used as outcome measure in the € 475,000 per €12 million (0 translog model life lost (61-65 years) – €43,000
Per patient specification
Only mortality as outcome
Two year outcome measure
years) (96+ years) Elasticity of spending per death avoided is €44,000 per €318,000 (0
used as input to calculate threshold of euro QALY (61-65 years) - €33,000 per QALYs years) (96+ years) per
QALY Spending in year t influences QALYs lost in Negative incalculable
Estimation of cost per
death avoided is transformed to QALYs
year t+1 marginal effects
Spending in year t influences QALYs lost in €60,000 per €41,000-€ year t plus in year t+1 QALY 79,000 per QALY Year dummies are included in the baseline € 73,600 per €59,000-€ model QALY 88,000 per QALY Obesity, smoking and heavy alcohol use are € 73,600 per €59,000-€ added as health trends QALY 88,000 per QALY
Health trends are added
93
