
Page 112 - Assessing right ventricular function and the pulmonary circulation in pulmonary hypertension Onno Anthonius Spruijt
P. 112
7
In recent years, temporal and spatial resolution has been further improved, allowing more accurate quantification of global function of both the left and right ventricle and the complex interaction between both ventricles in PH [4, 5]. Short-axis images are used to reconstruct a 3D image of the right and left ventricle (LV), allowing the measurements of ventricular volumes and wall mass at all phases of the cardiac cycle.
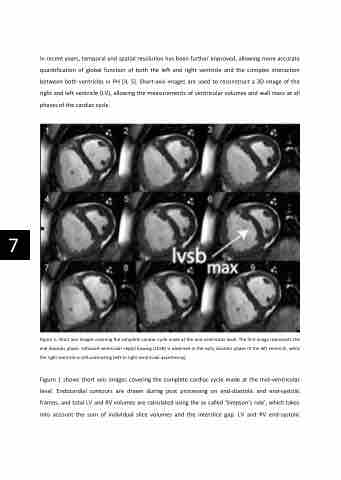
Figure 1: Short axis images covering the complete cardiac cycle made at the mid-ventricular level. The first image represents the end diastolic phase. Leftward ventricular septal bowing (LVSB) is observed in the early diastolic phase of the left ventricle, while the right ventricle is still contracting (left to right ventricular asynchrony).
Figure 1 shows short axis images covering the complete cardiac cycle made at the mid-ventricular level. Endocardial contours are drawn during post processing on end-diastolic and end-systolic frames, and total LV and RV volumes are calculated using the so called ‘Simpson’s rule’, which takes into account the sum of individual slice volumes and the interslice gap. LV and RV end-systolic
