
Page 61 - Risk quantification and modification in older patients with colorectal cancer
P. 61
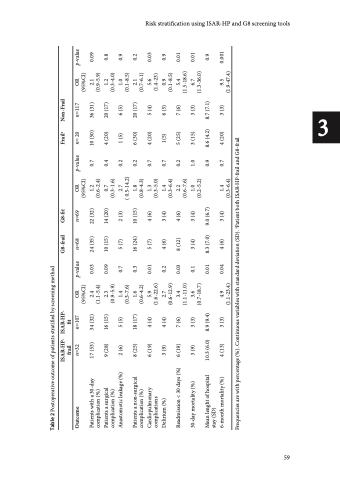
                                Risk stratification using ISAR-HP and G8 screening tools
                                       59
3
 Table 2 Postoperative outcome of patients stratified by screening ISAR-HP- ISAR-HP-
method
Outcome
n=32 17 (53) 9 (28)
2 (6)
8 (25) 6 (19) 3 (9)
6 (19)
3 (9) 10.3 (6.0) 4 (13)
n=107 OR (95%CI)
p-value 0.03 0.09 0.7 0.3 0.01 0.2 0.03 0.1 0.01 0.04
n=68 24 (35) 10 (15) 5 (7) 16 (24) 5 (7) 4 (6) 8 (12) 3 (4) 8.3 (7.0) 4 (6)
n=69 22 (32) 14 (20) 2 (3) 10 (15) 4 (6) 3 (4) 4 (6)
3 (4) 9.0 (6.7) 3 (4)
OR (95%CI)
p-value 0.7 0.4 0.2 0.2 0.7 0.7 0.2 1.0 0.9 0.7
n= 20 10 (50) 4 (20) 1 (5) 6 (30) 4 (20) 1(5)
5 (25) 3 (15) 8.6 (4.2) 4 (20)
n=117 36 (31) 20 (17) 6 (5) 20 (17) 5 (4)
p-value 2.1 0.09
Patients with a 30-day complication (%)
34 (32) 2.4 (1.1-5.4)
1.2 (0.6-2.4)
(0.9-5.9)
Patients a surgical complication (%)
16 (15) 2.3 (0.9-5.9)
0.7 (0.3-1.6)
1.2 0.8 (0.3-4.0)
Anastomotic leakage (%)
5 (5) 1.4 (0.3-7.6)
2.7
( 0.5-14.2)
1.0 0.9 (0.1-8.5)
Patients a non-surgical complication (%)
18 (17) 1.6 (0.6-4.2)
1.8 (0.8-4.3)
2.1 0.2 (0.7-6.1)
Cardiopulmonary complications
4 (4) 5.9 (1.6-22.6)
1.3 (0.3-5.0)
5.6 0.03 (1.4-23)
Delirium (%)
4 (4) 2.7 (0.6-12.9)
1.4 (0.3-6.4)
6 (5) 7 (6)
3 (3) 8.7 (7.1) 3 (3)
0.9 0.9 (0.1-8.5)
Readmission < 30 days (%)
7 (6) 3.4 (1.1-11.0)
2.2 (0.6-7.6)
5.4 0.01 (1.5-18.6)
30-day mortality (%)
3 (3) 3.6 (0.7-18.7)
1.0 (0.2-5.2)
6.7 0.01 (1.3-36.0)
Mean lenght of hospital stay (SD)
8.9 (9.4)
0.9
frail
fit
G8-frail
G8-fit
Fraila
Non-Frail
6-month mortality (%)
Frequencies are with percentage (%). Continuous variables with standard deviation (SD). aPatient both ISAR-HP-frail and G8-frail
9.5 0.001 (1.9-47.4)
3 (3) 4.9 (1.1-23.4)
1.4 (0.3-6.4)
OR (95%CI)
