
Page 164 - Risk quantification and modification in older patients with colorectal cancer
P. 164
Chapter 8
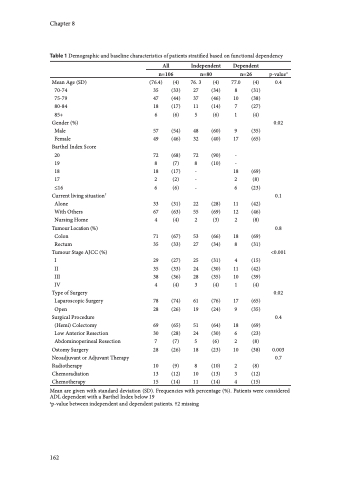
Table 1 Demographic and baseline characteristics of patients stratified based on functional dependency
All n=106
(76.4) (4) 35 (33) 47 (44) 18 (17)
Independent n=80
Dependent n=26
Mean Age (SD) 70-74
75-79
80-84
85+ Gender (%)
Male
Female
Barthel Index Score
20 19 18 17 ≤16
Current living situation† Alone
With Others
Nursing Home
Tumour Location (%) Colon
Rectum
Tumour Stage AJCC (%) I
II III IV
Type of Surgery Laparoscopic Surgery Open
Surgical Procedure
(Hemi) Colectomy
Low Anterior Resection Abdominoperineal Resection
Ostomy Surgery
Neoadjuvant or Adjuvant Therapy Radiotherapy
Chemoradiation
Chemotherapy
76. 3 27 37 11
(4) (34) (46) (14)
p-valuea 77.0 (4) 0.4
6 (6) 5 (6) 1 (4)
0.02
57 (54) 49 (46)
48 (60) 9 (35) 32 (40) 17 (65)
72 (90) -
72 (68)
8 (7) 8 (10) -
18 (17) - 18 (69) 2 (2) - 2 (8) 6 (6) - 6 (23)
33 (31) 22 67 (63) 55 4 (4) 2
71 (67) 53 35 (33) 27
29 (27) 25 35 (33) 24 38 (36) 28
(28) 11 (42) (69) 12 (46) (3) 2 (8)
(66) 18 (69) (34) 8 (31)
(31) 4 (15) (30) 11 (42) (35) 10 (39)
0.1
0.8 <0.001
4 (4) 3 (4) 1 (4)
0.02
78 (74) 28 (26)
69 (65) 30 (28) 7 (7) 28 (26)
10 (9) 13 (12) 15 (14)
61 (76) 17 19 (24) 9
51 (64) 18 24 (30) 6 5 (6) 2 18 (23) 10
8 (10) 2 10 (13) 3 11 (14) 4
(65) (35)
(69) (23) (8)
(38) 0.003 0.7
8 (31) 10 (38) 7 (27)
0.4
Mean are given with standard deviation (SD). Frequencies with percentage ADL dependent with a Barthel Index below 19
ap-value between independent and dependent patients. †2 missing
(8)
(12)
(15)
(%). Patients were considered
162
