Page 29 - Governing Congo Basin Forests in a Changing Climate • Olufunso Somorin
P. 29
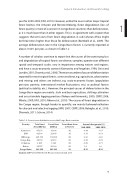
Table 1-2: Forest-cover distribution across the Congo Basin countries
Cameroon CAR
DR Congo Congo Rep. E. Guinea Gabon Congo Basin
47 271
62 300 226 705
34 150 2 805 25 767 398 264
19 916 22 605 154135 22 411 1 626 22 000 242 693
42 -0.94 36 -0.13 68 -0.20 66 -0.08 58 -0.65 85 0.0 59 -0.33
-1.07 -0.13 -0.20 -0.05 -0.71 0.0 -0.36
General Introduction and Research Setting
year for 2000-2005 (FAO, 2010). However, unlike the case in other major tropical
forest biomes, the Amazon and Borneo-Mekong, forest degradation (loss of 1 forest quality) is more of a concern in Congo Basin countries than deforestation,
as it is much lower than in other regions. This is in agreement with a report that
suggests that emissions from forest degradation in sub-Saharan Africa might
be three times higher than those for deforestation (Bombelli et al., 2009). The
average deforestation rate in the Congo Basin forests is currently reported at
about -0.36% per year, as shown in Table 1.2
A number of scholars continue to report that the causes of the continuing loss and degradation of tropical forests are diverse, complex, operate over different spatial and temporal scales, vary in importance among nations and regions, and have a socio-economic context (Kaimowitz and Angelsen, 1998; Geist and Lambin, 2001; Chomitz, et al., 2006). There are a number of causes of deforestation reported for most tropical forests, some are direct, e.g. agriculture, urbanization and mining; and others are indirect, e.g. socio-economic factors (population pressure, poverty, international market fluctuations, etc.) or political factors (political instability, etc.). However, the principal causes of deforestation in the Congo Basin region are mainly: slash and burn agriculture, shifting cultivation and unsustainable logging practices (Ndoye and Kaimowitz, 2000; CBFP, 2008; Mbatu, 2009; FAO, 2010; Nkem et al., 2010). The causes of forest degradation in the Congo region, though harder to quantify, are mainly fuelwood collection for charcoal and selective logging (WRI, 2007; CBFP, 2008; Robiglio, et al., 2010; Dkamela, 2011; Schure, 2014)
Country
Total Land Area (000 ha)
Forest Area (000 ha)
Forest Area share in TLA (%)
Annual change rate (%)
1990-2000
2005-2010
Sources: CBFP 2008; FAO (Forest Resource Assessment) 2010
9