
Page 130 - Tailoring Electrospinning Techniques for Regenerative Medicine - Marc Simonet
P. 130
CHAPTER 6
There was no significant di erence in the fatigue behavior between 2 and 10 Hz measurement frequency for the non-sterile PCL sca olds. The stress response at 10% strain of the PCL sca olds decreased with both frequencies in a similar matter (Figure 6.2a). Also with both protocols tested, the sca olds failed a er a similar amount of cycles (Figure 6.2b). The non-sterilized PCL sca olds loosing 90% of their original strength a er 4.9*104±2.0*104 cycles with 2 Hz and a er 5.1*104±0.9*104 cycles with the 10 Hz measuring frequency. With 0.8*104±0.2*104 cycles for the 10 Hz vs. 1.1*104±0.3*104 for the 2 Hz measurement frequency, the γ-sterilized PCL sca olds fail significantly faster at 10 Hz. At both
measurement frequencies, the γ-sterilized sca olds fail significantly faster than the not sterilized sca olds (p<0.005 for 2 Hz and p<0.0001 for 10 Hz).
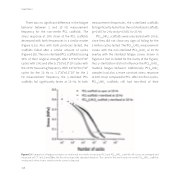
PCL2kU4Un sca olds were only tested with 10 Hz, since they did not show any signs of failing for the 3 million cycles tested. The PCL2kU4Un measurement curves with the non-sterilized PCL2kU4Un at 10 Hz overlay with the sterilized fatigue curves shown in Figure 6.3 (not included for the clarity of the Figure), thus γ-sterilization did not influence the PCL2kU4Un, material fatigue behavior. Additionally PCL2kU4Un samples had also a more constant stress response at 10% strain compared to PCL. A er 3 million cycles, PCL2kU4Un sca olds still had two-third of their
Figure 6.3 Comparison of fatigue resistance on sterile and non-sterile electrospun PCL and PCL2kU4Un, sca olds. All curves are averaged and measured at 37°C in H2O and 10Hz; the fine lines depict the standard deviation. The curve for the sterile and non-sterile PCL2kU4Un, sca olds overlay each other, hence only the sterile curves is depicted.
128
