
Page 114 - Reduction of coercive measures
P. 114
Chapter 5
measures that were ended was significantly larger than in the control group. 9.3% of the variance in reduction across coercive measures nested within residents and units is explained by the intervention.
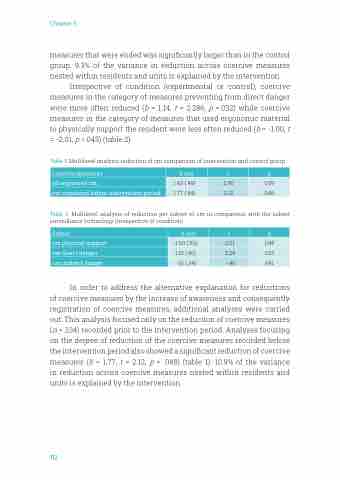
Irrespective of condition (experimental or control), coercive measures in the category of measures preventing from direct danger were more often reduced (b = 1.14, t = 2.286, p =.032) while coercive measures in the category of measures that used ergonomic material to physically support the resident were less often reduced (b = -1.00, t = -2.01, p =.045) (table 2).
Table 1: Multilevel analysis reduction of cm comparison of intervention and control group
Table 2: Multilevel analysis of reduction per subset of cm in comparison with the subset surveillance technology (irrespective of condition)
In order to address the alternative explanation for reductions of coercive measures by the increase of awareness and consequently registration of coercive measures, additional analyses were carried out. This analysis focused only on the reduction of coercive measures (n = 234) recorded prior to the intervention period. Analyses focusing on the degree of reduction of the coercive measures recorded before the intervention period also showed a significant reduction of coercive measures (b = 1.77, t = 2.12, p = .048) (table 1). 10.9% of the variance in reduction across coercive measures nested within residents and units is explained by the intervention.
Coercive measures
b (se)
t
p
all registered cm
1.43 (.49)
2.90
.009
cm registered before intervention period
1.77 (.84)
2.12
.048
Subset
b (se)
t
p
cm physical support
-1.00 (.50)
-2.01
.045
cm direct danger
1.15 (.50)
2.29
.023
cm indirect danger
-.16 (.34)
-.46
.641
112
