
Page 93 - scheppingen
P. 93
DYSREGULATION OF THE (IMMUNO)PROTEASOME PATHWAY IN MCD
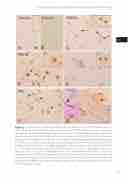
Figure 3 β5 proteasome subunit immunoreactivity in control, FCD type IIa, FCD type IIb and TSC. Panels A and B: (control) show weak immunoreactivity in both cortex (A; insert: neuron) and white matter (B; not detectable glial expression). Panel C (FCD IIa) shows positive dysmorphic neurons (arrows; insert: high magnification, nuclear expression). Panels D-E (FCD IIb) show sever- al β5 positive cells within cortex (D) and white matter (E), including dysmorphic neurons (arrows in D and insert, nuclear and cytoplasmic expression), glial cells (arrow-heads and insert in D) and balloon cells ( asterisks in E; insert: high magnification, with prominent nuclear expression). Panels F-G (TSC-tuber): β5 subunit expression is observed within the tuber in dysmorphic neurons (ar- rows in F; insert b in panel G: co-localization with the neuronal marker NeuN; insert c in panel G, co-localization with GFAP) and in giant cells (arrow in G and insert a; insert b: co-localization with NeuN; insert c: expression in glial cells, co-localization with GFAP). The inserts within panels show imagines of the different cells types at higher magnification in separate specimens. Scale bar in G: A-C, G: 80 μm; D-F: 40 μm.
91
four
