
Page 179 - scheppingen
P. 179
DISCUSSION
A
Grey matter
8 6 4 2
0 0 0 0 0
lesional perituberal
B
Grey matter
80 60 40 20
0
Type A
Type B
Type C perituberal
C
White matter
100
80
60
40
20
0
lesional perituberal
D
White matter
1
00 80 60 40 20
0
Type A
Type B
Type C perituberal
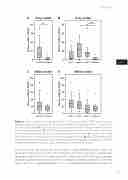
Figure 2. Gliosis is prominent in the grey matter in TSC cortical tubers. GFAP expression (per- centage of total area positive for GFAP) was semi-automatically quantified in TSC cortical tubers and perituberal tissue. A GFAP expression was increased in cortical tuber grey matter (GM) com- pared to perituberal tissue. B GM GFAP expression was increased in type B and C tubers com- pared to perituberal tissue. Gliosis was most prominent in type B tubers. C In white matter (WM), GFAP expression in the tuber did not differ from perituberal tissue. D WM GFAP expression did not differ between tuber types A, B or C and perituberal tissue. **p<0.01, ***p<0.001, Kruskall-Wal- lis with Man-Whitney U test for pairwise comparisons, circles indicate outliers.
cyte functioning and myelination. Interestingly, multiple proof-of-concept studies are described, indicating that healthy mTOR complex 1 (mTORC1) signaling is indispensable for proper myelin synthesis in myelinating cells, and that loss of function of this complex leads to impaired myelination (reviewed in 18). However, hyperactivation of mTORC1 due to loss of TSC1 in oligodendrocytes or TSC2 in oligodendrocyte precursor cells was
177
seven
Gliosis in WM (% GFAP) Gliosis in GM (% GFAP)
Gliosis in WM (% GFAP) Gliosis in GM (% GFAP)
