
Page 119 - scheppingen
P. 119
EXPRESSION OF MICRORNAS MIR21, MIR146A, AND MIR155 IN TSC
RNA isolation
For RNA isolation, frozen brain material or cell culture material was homogenized in Qiazol Lysis Reagent (Qiagen Benelux, Venlo, The Netherlands). Total RNA including the miRNA fraction was isolated using the miRNeasy Mini kit (Qiagen Benelux, Venlo, the Netherlands) according to the manufacturer’s instructions. The concentration and purity of RNA were determined at 260/280 nm using a Nanodrop spectrophotome- ter (Ocean Optics, Dunedin, FL, USA) and Qubit® 2.0 Fluorometer (Life Technologies, Grand Island, New York, USA).
Real-time quantitative analysis (qPCR)
miRNA (miR21, miR146a, miR155 and the U6B small nuclear RNA gene, RNU6B; miR23a) expression was analyzed using Taqman microRNA assays (Applied Biosystems, Foster City, CA, USA). cDNA was generated using Taqman MicroRNA reverse transcription kit (Applied Biosystems, Foster City, CA, USA) according to the manufacturer’s instructions and the PCRs were run on a Roche Lightcycler 480 thermocycler (Roche Applied Science, Basel, Switzerland). Quantification of data was performed using the computer program LinRegPCR in which linear regression on the Log (fluorescence) per cycle number data is applied to determine the amplification efficiency per sample 43, 44. The starting concen- tration of each specific product was divided by the starting concentration of a reference gene (RNU6B or miR23a) and this ratio was compared between groups. To evaluate IL-1β, IL-6, COX-2 and the miRNA targets (IRAK1, IRAK2, TNF receptor associated factor 6 (TRAF6), PDCD4, SHIP, ERB4, MEF2C, Notch-1 and PTEN), 200 ng of cell culture-derived total RNA or 2.5 μg human brain material-derived total RNA was reverse-transcribed into cDNA using oligo dT primers (see Supp. Table 2 for primer sequences).
Viability assay and IL-6 release
To determine the viability of U373 and fetal cells with flow cytometry, suspended cells were incubated with eFluor dye (1:2000, Fixable viability dye eFluor 780, eBioscience, San Diego, CA, USA) for 30 min on ice and washed with PBS/1% bovine serum albumin
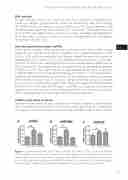
Figure 1 Quantitative real-time PCR of miR21, miR146a and miR155 in TSC. Expression levels of miR21, miR146a and miR155 in TSC cortical tubers and perituberal cortex (n=4). Data are expressed relative to the levels observed in control cortex (n=10); miRNA expression was normalized to that of the U6B small nuclear RNA gene (RNU6B). The error bars represent SEM; statistical signifi- cance: *p<0.05, **p<0.01, Kruskal-Wallis test followed by Dunn’s multiple comparison test.
117
five
