
Page 71 - Imaging of Osteoarthritis and Rheumatoid Arthritis in Hand Joints
P. 71
Accuracy of cartilage MRI of CMC1; comparison with histology
Each histological section was scored for the amount of the articular surface that corresponded to each grade in decimals of percentage (i.e. 0%, 10%, 20% etc). The sum of the scores for each section had to be 100%. If there was no identifiable articular surface in a section, then no score was assigned to that section. Finally, all section scores per patient were averaged to calculate the total percentage area of (near) normal cartilage thickness, partial-thickness cartilage loss, and full-thickness cartilage loss.
4
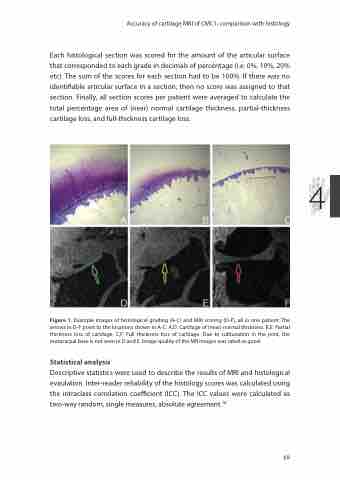
Figure 1. Example images of histological grading (A-C) and MRI scoring (D-F), all in one patient. The arrows in D-F point to the locations shown in A-C. A,D: Cartilage of (near) normal thickness. B,E: Partial thickness loss of cartilage. C,F: Full thickness loss of cartilage. Due to subluxation in the joint, the metacarpal base is not seen in D and E. Image quality of the MR images was rated as good.
Statistical analysis
Descriptive statistics were used to describe the results of MRI and histological evaulation. Inter-reader reliability of the histology scores was calculated using the intraclass correlation coefficient (ICC). The ICC values were calculated as two-way random, single measures, absolute agreement.18
69
