
Page 36 - Imaging of Osteoarthritis and Rheumatoid Arthritis in Hand Joints
P. 36
Chapter 2
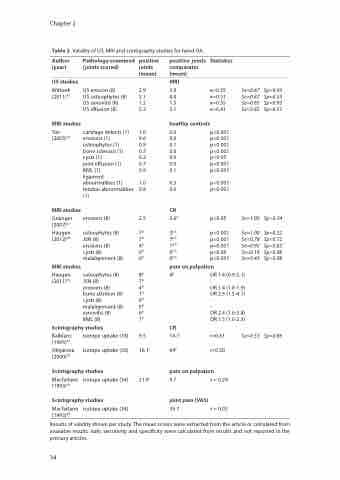
Table 2. Validity of US, MRI and scintigraphy studies for hand OA.
Author (year)
US studies
Wittoek (2011)53
MRI studies
Tan (2005)29
MRI studies
Grainger (2007)33
Haugen (2012)36
MRI studies
Haugen (2011)35
Pathology examined positive (joints scored) joints
positive joints
Statistics
κ=0.55 Se=0.67 κ=0.51 Se=0.87 κ=0.55 Se=0.65 κ=0.41 Se=0.83
osteophytes (8) 8b 4b JSN (8) 7b
erosions (8) 4b
bone attrition (8) 1b
cysts (8) 0b malalignment (8) 0b synovitis (8) 6b BML (8) 1b
OR 1.4 (0.9-2.1) -
OR 1.4 (1.0-1.9) OR 2.5 (1.5-4.1) -
-
OR 2.4 (1.6-3.8) OR 1.5 (1.0-2.3)
Scintigraphy studies CR
Balblanc isotope uptake (18) 9.5 14.1i r=0.61 (1995)32
Olejárova isotope uptake (30) 16.1j 64k r=0.50 (2000)50
Se=0.53 Sp=0.86
Scintigraphy studies
Macfarlane isotope uptake (34) 21.9 (1993)28
Scintigraphy studies
Macfarlane isotope uptake (34) (1993)28
pain on palpation
9.7 τ = 0.24
joint pain (VAS)
39.7 τ = 0.02
comparator (mean) (mean)
US erosion (8) 2.9 US osteophytes (8) 5.1 US synovitis (8) 1.2 US effusion (8) 5.3
cartilage defects (1) 1.0 erosions (1) 0.6 osteophytes (1) 0.9 bone sclerosis (1) 0.7 cysts (1) 0.2 joint effusion (1) 0.7 BML (1) 0.9 ligament
abnormalities (1) 1.0 tendon abnormalities 0.8 (1)
erosions (8) 2.5
osteophytes (8) 7b JSN (8) 7b erosions (8) 4b cysts (8) 0b malalignment (8) 0b
MRI
3.9 4.4 1.5 5.1
Sp=0.93 Sp=0.55 Sp=0.93 Sp=0.57
healthy controls
0.0 p<0.001 0.0 p<0.001 0.1 p<0.001 0.0 p<0.001 0.0 p<0.05 0.0 p<0.001 0.1 p<0.001
0.3 p<0.001 0.0 p<0.001
CR
0.6d p<0.05 Se=1.00 3b,h p<0.001 Se=1.00
7b,h p<0.001 Se=0.78 1b,h p=0.001 Se=0.95 0b,h p=0.66 Se=0.16 0b,h p<0.001 Se=0.43
pain on palpation
Sp=0.34
Sp=0.22 Sp=0.72 Sp=0.63 Sp=0.96 Sp=0.98
Results of validity shown per study. The mean scores were extracted from the article or calculated from available results. italic sensitivity and specificity were calculated from results and not reported in the primary articles.
34
