
Page 118 - Secondary school students’ university readiness and their transition to university Els van Rooij
P. 118
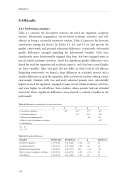
                                Table 4.5 Parental education di erences
Self-e cacy in being successful at university
 Table 4.4 Coursework di erences
Variable
Need for cognition
Academic interest
Behavioural engagement Out-of-school academic activities Self-e cacy
M (SD) hum & soc
3.34 (0.49) 2.67 (0.71) 3.62 (0.78) 2.19 (0.73) 2.60 (0.48)
M (SD) science
3.48 (0.46) 3.06 (0.61) 3.60 (0.77) 2.31 (0.73) 2.56 (0.49)
t p
-3.09 <.01 -6.42 <.01 .22 .82 -1.79 .07 0.85 .40
Cohen’s d
.30 .59 -.03 .16 -.08
   Notes: hum & soc = students taking humanities and social sciences coursework; science = students taking science coursework.
 Variable
Need for cognition
Academic interest
Behavioural engagement
Out-of-school academic activities
Self-e cacy
M (SD) 0
3.36 (.50) 2.85 (.70) 3.58 (.78)
2.17 (.70)
2.53 (.47)
M (SD) 1
3.47 (.44) 2.87 (.74) 3.64 (.77)
2.29 (.75) 2.66 (.50)
M (SD) 2
3.57 (.44) 2.98 (.58) 3.66 (.76)
2.51 (.77) 2.66 (.50)
F p Cohen’s d
5.60 <.01 .45
.94 .39 .20 4 .37 .69 .10
6.50 <.01 .46 4.11 .02 .27
   Notes: 0 = students whose parents had not attended university; 1 = students for whom 1 of the parents attended university; 2 = students for whom both parents attended university. Cohen’s d is the standardised di erence between the score of students with zero university-educated parents and students with two university-educated parents.
4.4.2 Path analysis
We  rst tested our conceptual model, as presented in Figure 4.1, with the e ects of the background variables we found in the t-tests and ANOVA.  is model achieved a good  t: χ29 = 17.33, p = .04 (N = 472); χ2/df = 1.93; RMSEA = .04 (90% con dence interval \[.01, .08\]), SRMR = .02, CFI = .98, and TLI = .95. However, two of the proposed pathways from gender were insigni cant: to need for cognition and to academic interest. Moreover, the pathway from parental education to academic self-e cacy was insigni cant, as was the pathway from behavioural engagement to academic self-e cacy.  erefore, we tested a second model, with the insigni cant pathways removed. Figure 4.2 depicts the path coe cients for the proposed relationships in this model.  e goodness-of- t statistics con rmed that this model  t the data very well: χ212 = 22.12, p = .04 (N = 472); χ2/df = 1.84; RMSEA = .04 (90% con dence interval \[.01, .07\]), SRMR = .04, CFI = .98, and TLI = .96.
Need for cognition, out-of-school academic activities, and academic interest related to students’ academic self-e cacy. Of these variables, need for cognition and academic interest had the greatest impacts (β = .24 (.05) and β
117
