
Page 82 - THE PERCEPT STUDY Illness Perceptions in Physiotherapy Edwin de Raaij
P. 82
Chapter 4
80
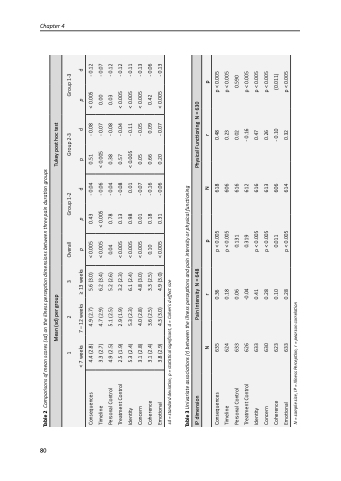
Table 2 Comparisons of mean scores (sd) on the illness perception dimensions between three pain duration groups Mean (sd) per group
Tukey post hoc test
Consequences Timeline
Personal Control Treatment Control Identity
< 0.005 < 0.005 0.04 < 0.005 < 0.005 < 0.005 0.10 < 0.005
0.43 < 0.005 0.78 0.13 0.98 0.01 0.18 0.31
0.01 - 0.07 - 0.16 - 0.06
Concern Coherence Emotional
0.09 0.42
- 0.07 < 0.005
< 7 weeks 4.4 (2.8) 3.3 (2.7) 4.9 (2.5) 2.5 (1.9) 5.3 (2.4) 3.1 (2.8) 3.1 (2.4) 3.8 (2.9)
7 – 12 weeks 4.9 (2.7) 4.7 (2.9) 5.1 (2.5) 2.9 (1.9) 5.3 (2.3) 4.0 (2.8) 3.6 (2.5) 4.3 (3.0)
≥ 13 weeks 5.6 (3.0) 6.2 (3.4) 5.2 (2.6) 3.2 (2.3) 6.1 (2.4) 4.8 (3.0) 3.3 (2.5) 4.9 (3.0)
p
p
d
- 0.04 - 0.06 - 0.04 - 0.08
p 0.51 < 0.005 0.38 0.57 < 0.005 0.05 0.66 0.20
d p
- 0.08 < 0.005 - 0.07 0.00
- 0.08 0.03
- 0.04 < 0.005 - 0.11 < 0.005 - 0.05 < 0.005
d
- 0.12 - 0.07 - 0.12 - 0.12 - 0.11 - 0.13 - 0.06 - 0.13
1
2
3
Overall
Group 1-2
Group 2-3
Group 1-3
sd = standard deviation, p = statistical significant, d = Cohen’s d effect size
Table 3 Univariate associations (r) between the illness perceptions and pain intensity or physical functioning
IP dimension
Physical Functioning N = 630 NrpNrp
Consequences Timeline
Personal Control Treatment Control Identity
635 0.36 624 0.18 633 0.06 626 -0.04 633 0.41 630 0.28 623 0.10 633 0.28
p < 0.005 p < 0.005 0.131 0.319 p < 0.005 p < 0.005 0.011 p < 0.005
618 0.48 606 0.23 616 0.02 612 - 0.16 616 0.47 613 0.26 606 - 0.10 614 0.32
p < 0.005 p < 0.005 0.590 p < 0.005 p < 0.005 p < 0.005 (0.011) p < 0.005
Concern Coherence Emotional
N = sample size, IP = Illness Perception, r = pearson correlation
Pain Intensity N = 648
